Trading models are built from historical relationships: a set of inputs is used to estimate a return, classify a market condition, or rank possible trades. Those relationships can weaken or change. A signal that once helped distinguish trend days from range bound sessions may stop doing so; volatility may rise enough to change the value of a position size rule. When a model’s live or simulated performance deteriorates over time, traders often call the problem model drift or performance decay.
That label does not identify the cause. A weaker result may reflect a real change in market behavior, a temporary run of bad outcomes, poor data, changing execution costs, or a model that was overfit from the start. Retraining can help with some of these problems and make others worse. A useful monitoring process therefore asks three questions: what changed, how strong is the evidence, and what action is justified? The answers should be set out before a live model starts losing money, not improvised after a difficult week.
What model drift means in trading
Model drift is a broad operational term for a decline in the reliability or usefulness of a deployed model as time passes. It can refer to changing market data, a change in the relationship between inputs and outcomes, or a measurable drop in forecast or trading performance. The terms are not always used consistently. In this article, data drift means the inputs or their distribution have changed; relationship drift means the connection between inputs and the target has changed; and performance decay means the model’s measured results have worsened. These can overlap, but they are not interchangeable.
A model can show data drift without becoming less useful. If the price range widens but the model still forecasts outcomes accurately after volatility is accounted for, an input shift alone may not justify a rebuild. The reverse can also happen: the distribution of the raw inputs looks familiar, yet a signal’s relationship with subsequent returns has weakened. A market model needs to be evaluated against its intended task, not against a generic test for whether recent observations look different from old ones.
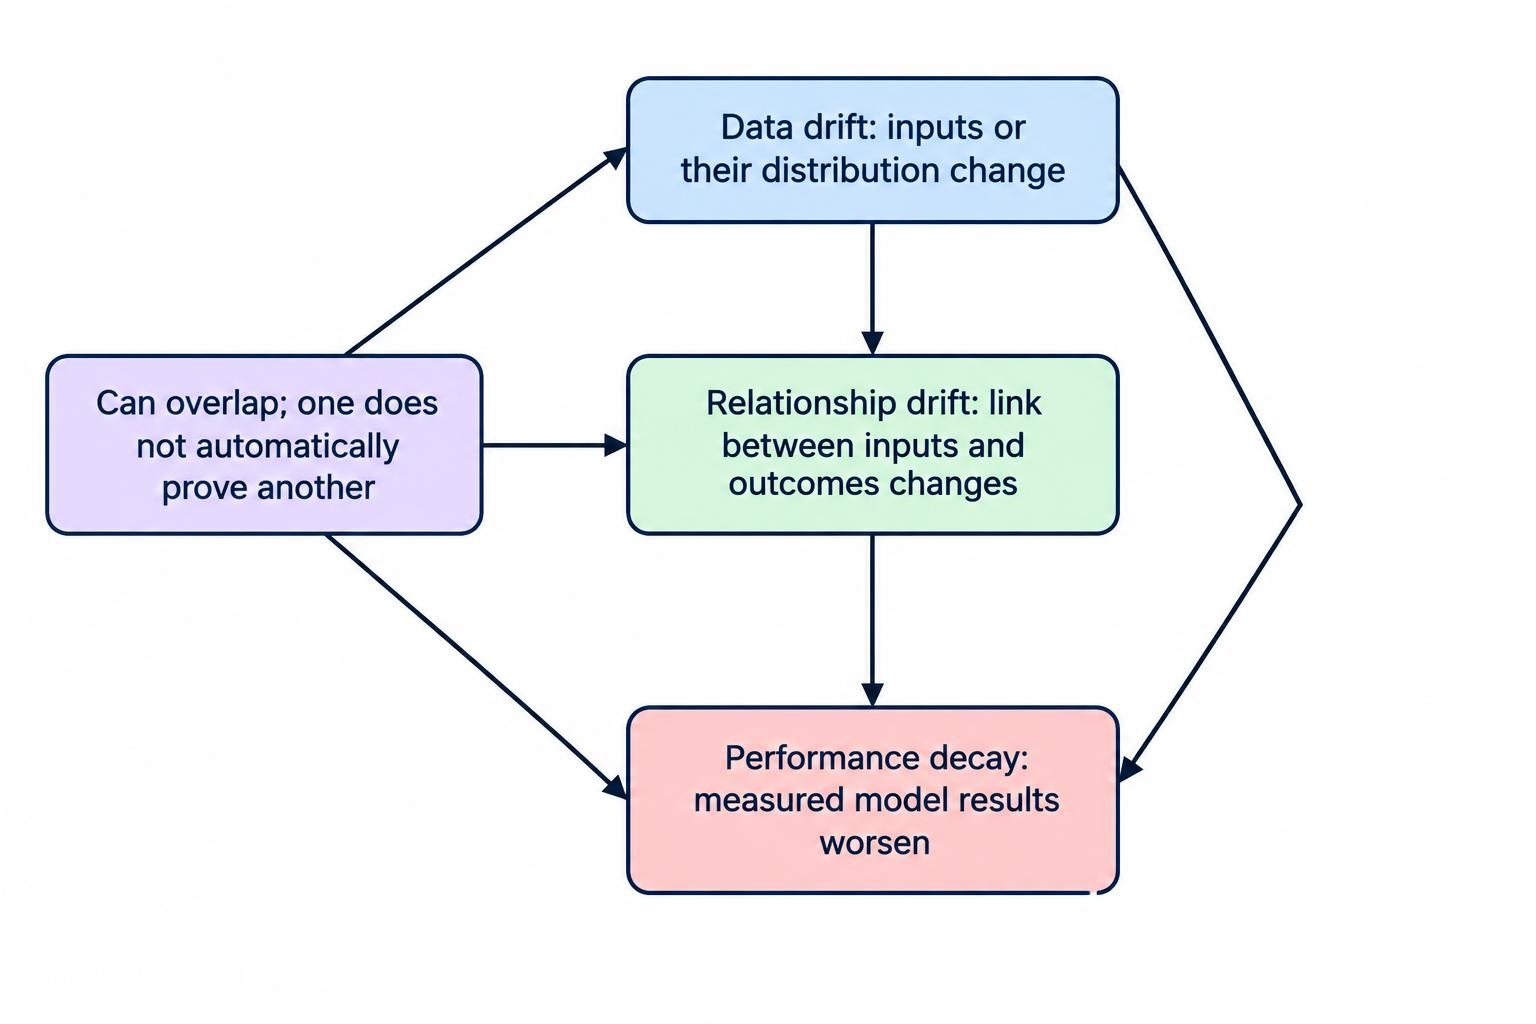
Market regime changes are related, but not identical, to model drift. A market regime describes a recurring pattern or state in market behavior, such as a persistent trend, a range, or a period of elevated volatility. Drift describes a change relevant to the model or its data. Regime classification may help explain a performance change, but a regime label is itself an estimate, and can arrive late or misclassify a transition. For more on the distinction, see market regime detection in trading models.
Why trading performance decays
Financial data do not arrive under a promise that past statistical relationships will hold indefinitely. Participants respond to new information, liquidity conditions change, and the mix of market activity shifts. Even a model whose inputs and code are unchanged may face different conditions from those in its training period. A study of drift detectors applied to financial time series found that detector behavior varied across the two tested series and model configurations. The author’s practical point is important: a detector should be assessed with the learner it will monitor, rather than treated as a stand alone guarantee. The financial time series drift detector study is an illustrative experiment, not proof that any detector will preserve trading returns.
Not all decay originates in the market. A data vendor may revise or change its feed; a field may be missing, delayed, or defined differently. A strategy can also be affected by higher spreads, slippage, financing charges, or partial fills, even if its forecasts remain accurate. Sometimes the model is not deteriorating at all: a short sequence of losing trades can occur by chance under a strategy whose expected behavior has not changed. A monitoring system that treats each bad patch as evidence of drift will fire too often and may replace a viable model with one that is less reliable.
There is also a less comfortable possibility: the model never had durable predictive value. A large number of candidate features, parameter settings, or strategies can be tried on the same history until one appears to work. The selected model may then perform poorly on new observations even without a dramatic market shift. Research on backtest selection describes why repeated searches can create overfitting and proposes methods to assess the risk. The research on backtest overfitting in investment strategies is a useful reminder that an apparent live decline cannot automatically be blamed on changing markets.
Signals to monitor
Monitor measures tied to what the system is meant to do. For a directional forecast, that may include forecast error, calibration, or the performance of predicted return groups. For a trade ranking model, measure whether higher ranked candidates continue to outperform lower ranked ones after costs. For a trading strategy, track realized returns alongside drawdown, turnover, exposure, and execution quality. Win rate alone is a thin diagnostic: it ignores the size of wins and losses, and can rise while the strategy’s net result worsens.
Use more than one time horizon. A short window can react quickly but is noisy; a longer window is steadier but can conceal a recent break. Compare the current window with a baseline that was defined in advance, and keep a record of how each measure is calculated. Where possible, record model output before the trade, the trade decision, the fill, and the eventual outcome separately. That makes it easier to distinguish a forecasting problem from a position sizing or execution problem. A practical set of measures and their limitations are covered in trading performance metrics beyond win rate.
| Monitoring signal | What it can indicate | What it cannot establish by itself |
|---|---|---|
| Forecast error or classification loss | Whether recent predictions are less accurate against observed outcomes | Whether the cause is a lasting market change or random variation |
| Calibration or ranking quality | Whether predicted probabilities or relative rankings still match results | Whether the resulting strategy remains profitable after costs |
| Input distributions and missing data | Changes in feature values, data coverage, or feed behavior | Whether the model’s decision quality has declined |
| Net returns, drawdown, and turnover | Whether the trading process is delivering its intended economic outcome | Whether the model, execution, costs, or market exposure caused the change |
| Spread, slippage, and fill quality | Whether execution conditions are consuming more of the strategy’s edge | Whether forecasts or signal rankings have become less informative |
Outcome labels may arrive after a delay. A prediction about the next day’s close can be evaluated sooner than a signal tied to a multiweek holding period. If the model is retrained before its earlier predictions have matured, the training set may be incomplete or biased toward quickly resolved outcomes. Define when an observation becomes eligible for evaluation and retraining, and use the same rule in testing and operation. This is part of choosing a prediction target for a trading model, not a minor bookkeeping detail.
Distinguish drift from noise and faults
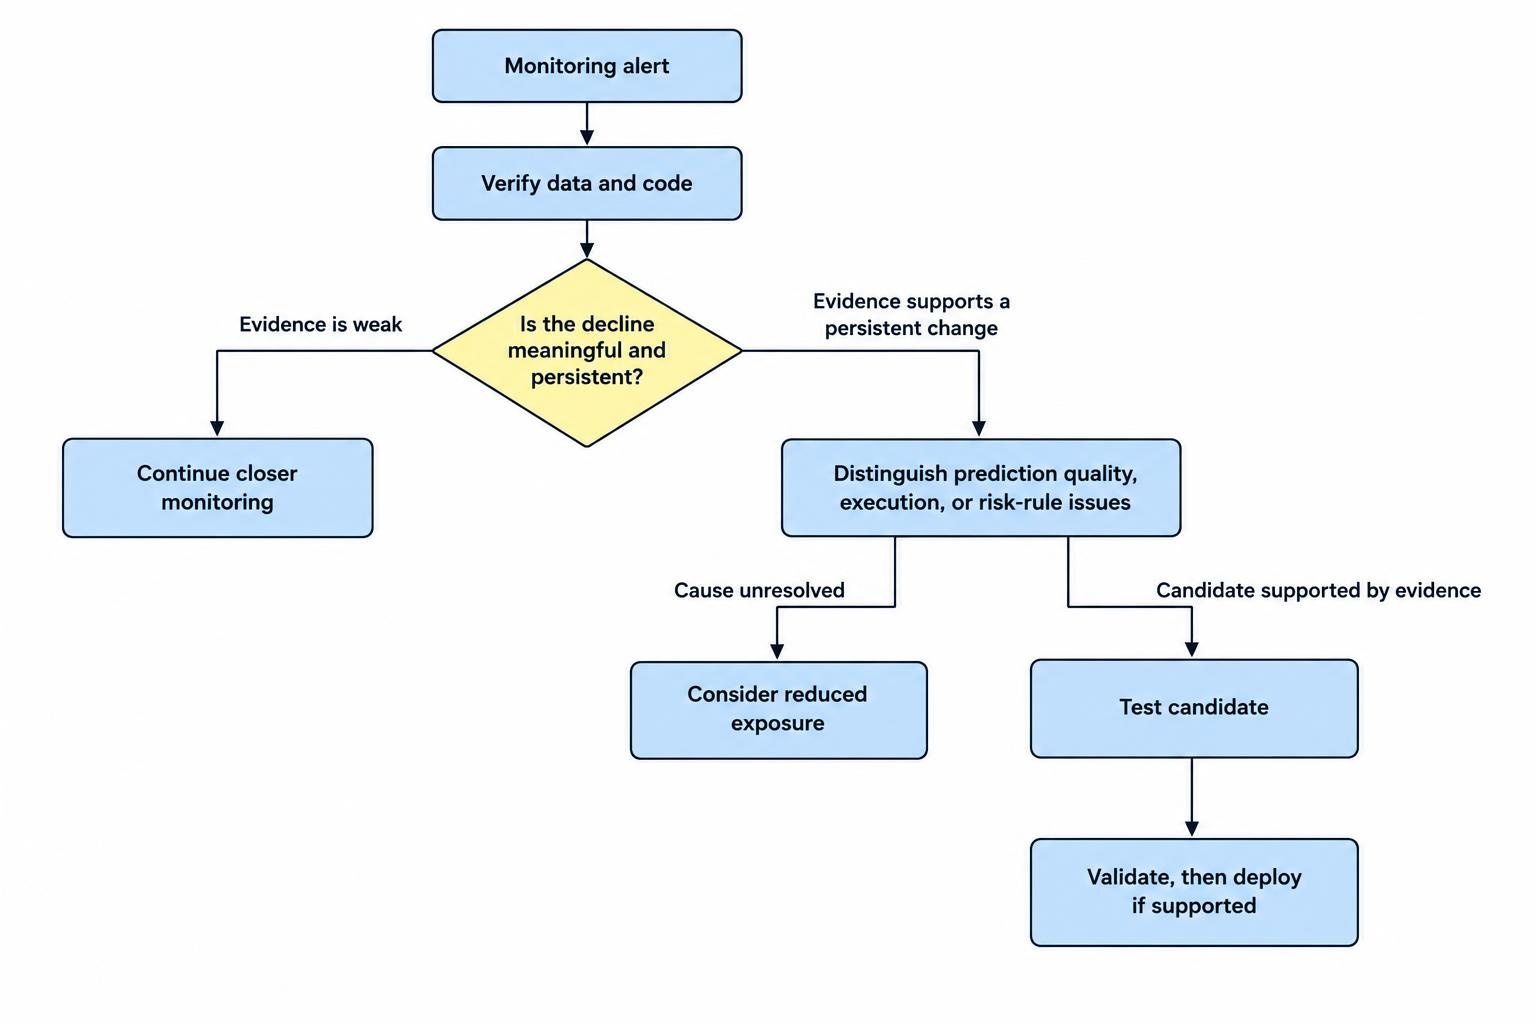
A drift alert is a prompt to investigate, not a command to retrain. Start by checking the data path: timestamps, missing values, duplicated records, price adjustments, feature calculations, and instrument mappings. Compare the live inputs with the values expected by the training pipeline. A broken feed can look like a sudden market regime change if the model sees an impossible price, a shifted column, or a feature computed in different units. Retraining on corrupted observations only teaches the model the wrong lesson faster.
Next, check whether the measured decline is meaningful for the strategy’s horizon and risk. A few trades are rarely enough to separate an actual performance change from ordinary variation. The required sample depends on how frequently the model acts, how noisy its outcomes are, and how large a deterioration would matter. Set thresholds using historical validation and simulations, rather than choosing a number because it looks reassuring. Where several monitoring measures are checked repeatedly, account for the fact that repeated checks can produce false alarms. The warning should prompt a review of evidence, not a claim that a precise market break has been located.
Then separate the forecast from the trading outcome. If prediction quality is stable but net returns fall, inspect transaction costs, market impact, sizing, constraints, and the conditions under which orders were filled. If prediction quality worsens while execution remains stable, investigate model inputs, target definition, and the relationship between signals and outcomes. If both shift at once, reduce exposure while the cause is unresolved, according to a prewritten control plan. An orderly investigation is less dramatic than changing several settings at once, and much more informative.
Choosing a response: pause, adjust, or retrain
There is no universal retraining interval. Updating every day may waste compute, react to noise, or let recent observations overwhelm useful history. Updating only once a year may leave a model stale. The right schedule depends on the data frequency, the label delay, the model’s sensitivity, and how costly a wrong decision is. A calendar schedule can be a reasonable baseline, but it should be paired with performance and data checks. A drift detector can add another signal, provided its false alarms, missed changes, and response delay are tested for the model and market being monitored.
Change one thing at a time where possible. A sensible response ladder may begin with a data and execution audit, followed by closer monitoring or lower risk limits. If there is evidence of a persistent change, compare a refreshed version with the deployed model and a simple benchmark. Retain the current model if the replacement does not pass the same tests. A retraining event is not proof of improvement, and a newly fitted model can be worse than the older one. The model drift testing process should therefore be part of a broader controlled process, not an automatic reset button.
Retraining may mean updating model parameters with new data, refitting the model from scratch, changing the training window, or revising the features. These actions have different effects. A rolling window emphasizes recent observations but discards older examples; a larger window preserves more history but may dilute a recent change. A weighted window can reduce the influence of older data without removing it entirely. No choice is neutral. Compare these approaches on chronological data, and record the rationale for selecting one.
Some learning systems use statistical detectors to watch a stream of prediction errors or other measures. ADWIN is one such method: it adjusts the size of its observation window and tests whether the average appears to have changed. Its original paper describes error monitoring as one way to flag a need to revise a model, while noting the tradeoff between keeping enough data for accuracy and discarding data that has become stale. The original ADWIN research paper describes the method; it does not establish that ADWIN is appropriate for every trading model. Any detector should be evaluated for its delay, false alerts, and downstream effect on trading decisions.
Validate the replacement before deployment
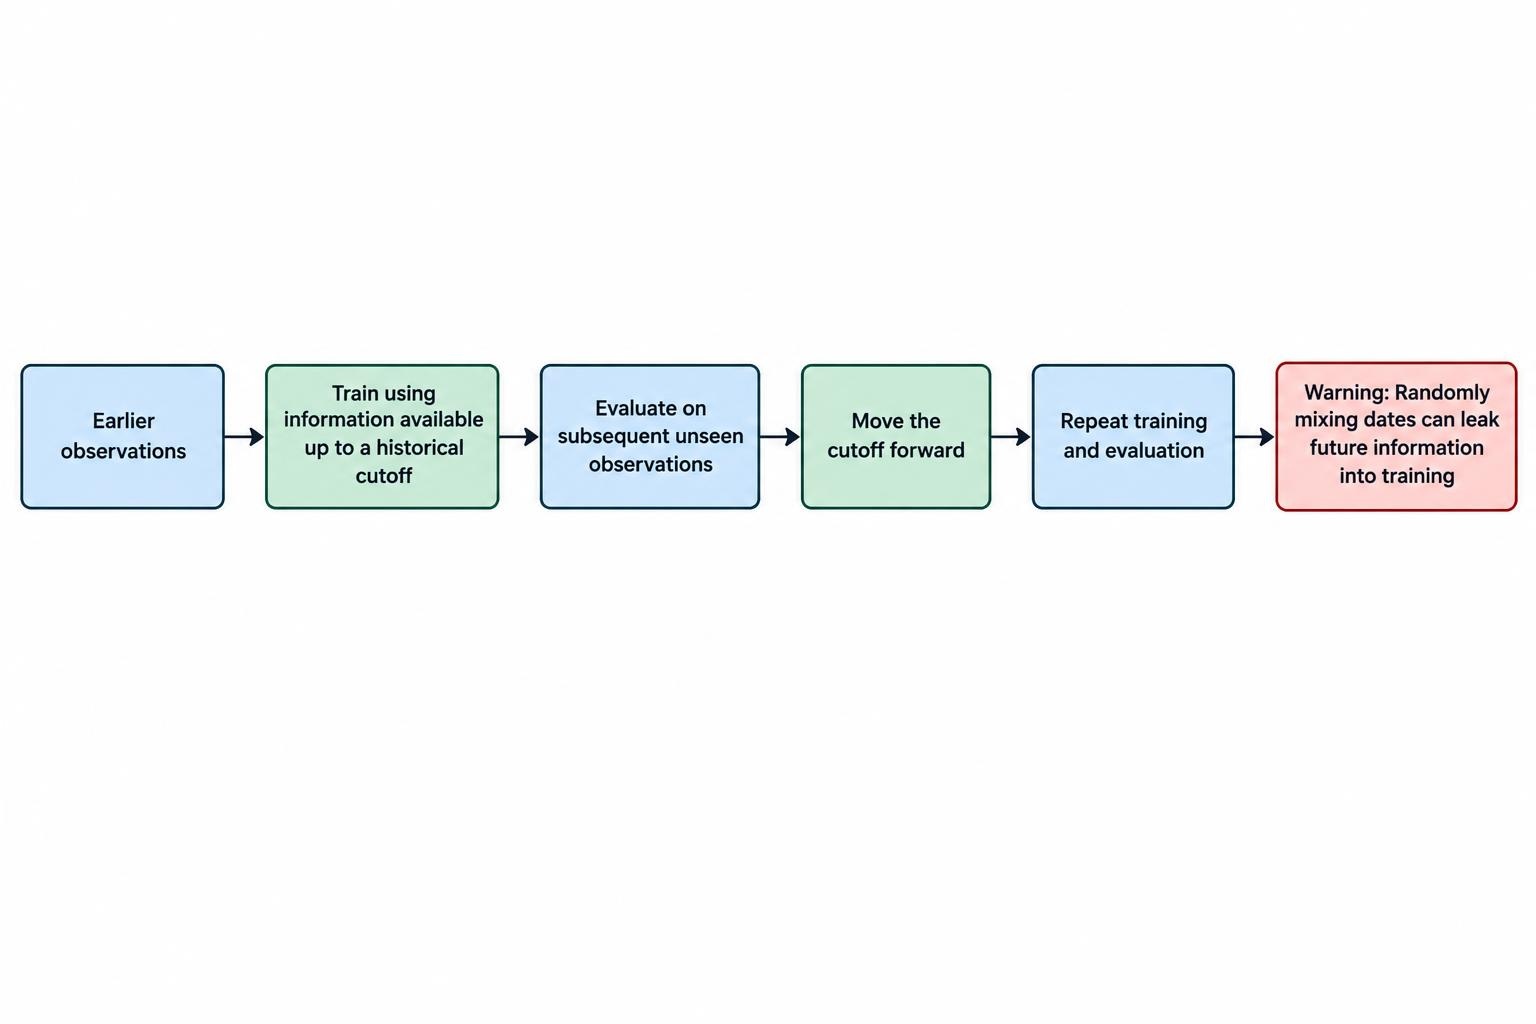
Keep time order intact. Fit the candidate using data available at each historical point, then evaluate it only on later observations. Randomly mixing dates between training and evaluation can let information from the future leak into the past. A walk forward test better reflects the process of repeatedly fitting a model, making predictions, and moving through time. The candidate should face the same data preparation, execution assumptions, and costs as the deployed model. For the mechanics of this evaluation, see walk forward testing for trading systems.
Do not tune the replacement repeatedly against the final test period. Each time results on that period influence a model choice, it becomes part of the selection process. Keep a separate holdout period or use another defensible evaluation design, and compare the number of candidate versions tried. Research on backtest overfitting emphasizes that ordinary holdout methods can be unreliable for investment simulations when many alternatives are tested. The practical protection is disciplined experiment tracking and a clear separation between model selection and the final evaluation, not a magical score that certifies future profits.
Include realistic trading costs and constraints. A refreshed model may produce more trades, trade at less liquid times, or turn over positions more often. Gross forecast quality may improve while net performance falls. Include spread, slippage, commissions, financing where relevant, and the strategy’s actual sizing rules in candidate evaluation. The related guide on including trading costs in backtests covers why costs belong in the comparison from the beginning, not as an adjustment after a promising result appears.
Compare the candidate with the current model and with a simple baseline. If the new model only wins under a narrow parameter choice, a short date range, or one unusually favorable market phase, the apparent gain may not survive live use. Review results across different periods and conditions, but avoid slicing the data into so many subgroups that chance patterns look persuasive. A candidate should meet predeclared minimum standards for performance, stability, risk, and operational behavior before it receives live capital.
Set retraining rules before a live model runs
A written policy makes retraining decisions consistent. It should specify which signals are monitored, how often they are checked, what counts as a warning, and who or what may authorize a change. Include a response for data faults, a sustained performance decline, a detector alert, and a rise in execution costs. State when the model should keep trading at reduced risk, when it should stop opening new positions, and what evidence is needed to restore normal operation. The rules should fit the strategy’s holding period and risk budget; a high frequency system and a monthly allocation model do not need identical thresholds.
Keep versions of the model, feature definitions, training data window, parameters, and evaluation results. Record the date and reason for every update, along with whether it was automatic or approved by a person. Without that history, a trader may be unable to tell whether performance changed after a new fit, a feed update, or a code change. Monitoring should cover the deployed model as well as the candidate model, and include alerts for data gaps or execution failures. A retrained model that cannot be audited or rolled back is an operational risk of its own.
For retail traders, the safest default is to treat model updates as controlled releases. Run a candidate in paper trading or shadow mode before it can place live orders, compare its predictions with the existing system, and confirm that position limits and order controls still work. Simulated results cannot prove live profitability, but they can expose broken features, unexpected turnover, or a candidate that behaves differently from its test. Set a maximum loss or exposure threshold that triggers review, and retain a tested path back to the previous version. The operational checklist for paper trading an AI system can help define what simulation can and cannot establish.
A practical decision sequence
When the alert arrives, first verify the data and code, then assess whether the decline is large enough and persistent enough to matter. Identify whether the problem sits in prediction quality, execution, or the risk rules. If the evidence is weak, keep the model under closer observation rather than reflexively retraining. If the evidence supports a lasting change, build and test a candidate on time ordered data, with costs and the original benchmark included. Deploy only after the candidate passes its defined checks, and keep a rollback option available.
This sequence does not remove uncertainty. It makes uncertainty manageable. A model may decay without a clean warning, and a detector may flag a harmless fluctuation. Retraining decisions work best when monitoring, testing, and live risk controls are designed together. For an end to end process linking research, execution, and review, see a structured AI assisted trading workflow.