Claims about trading software often arrive as a handful of impressive numbers: a 90% win rate, a backtest that turns a small balance into a fortune, or a promise of steady monthly gains. Those figures are not enough to show that an AI trading system is reliable. A win rate leaves out the size of losses, a backtest may depend on assumptions that do not hold in live markets, and no model can guarantee future trading profits.
Evaluate the evidence behind each number before paying for a tool, connecting it to an account or depositing money with a provider. Ask what was measured, how it was calculated, which costs were included, and whether the result came from real trades or a simulation. If the answers are vague, the claim is not verified. It may be marketing, a weak test or a warning sign of fraud.
What a trading performance claim actually tells you
Every performance figure answers a narrow question. A win rate tells you the share of trades that closed with a profit under the provider’s definition. It does not show how much those trades earned or lost, how often the system traded, or what happened to the account during its worst period. A statement such as “eight out of ten trades win” can sound compelling while concealing a small average gain and a much larger average loss.
Backtest returns answer a different question: how a set of rules would have performed when applied to historical data under specified assumptions. They are not the same as a verified live record. Simulated results can be useful for research, but only if the method, data and limitations are disclosed clearly enough to assess. The SEC’s investment adviser marketing rule guide describes requirements that apply to advertisements by SEC registered or required to be registered investment advisers, including conditions for presenting hypothetical performance. It is not a blanket rule governing every trading app or bot seller.
A guaranteed-return claim is different again. It promises an outcome in advance, often while minimizing or denying risk. Trading involves uncertainty; a model can fail, market conditions can change, and a live order may execute at a different price than expected. The CFTC warns that promoters have used AI trading claims to advertise unreasonably high or guaranteed returns. Treat a promise of guaranteed trading profits as a serious warning, not as evidence of a safer or smarter model.
How to assess a claimed win rate
Start by asking what counts as a “win.” Does the seller count a trade as profitable before or after commissions, spread, slippage, financing and subscription fees? Are partial exits treated as separate trades? Are open positions excluded? Does the figure represent every signal issued, or only signals the provider says were followed? Without consistent definitions and a complete record, the percentage can be shaped to look better than the trading experience it is meant to describe.
Then ask how many trades are included and over what dates. A high win rate from a small sample is weak evidence; it may reflect chance or a period that suited the strategy. A useful record should show the full period, the number of trades, the instruments traded and the rules used to enter and exit. It should also explain how losses were counted. A system that records frequent tiny wins and occasional large losses can report a high win rate while losing money overall.
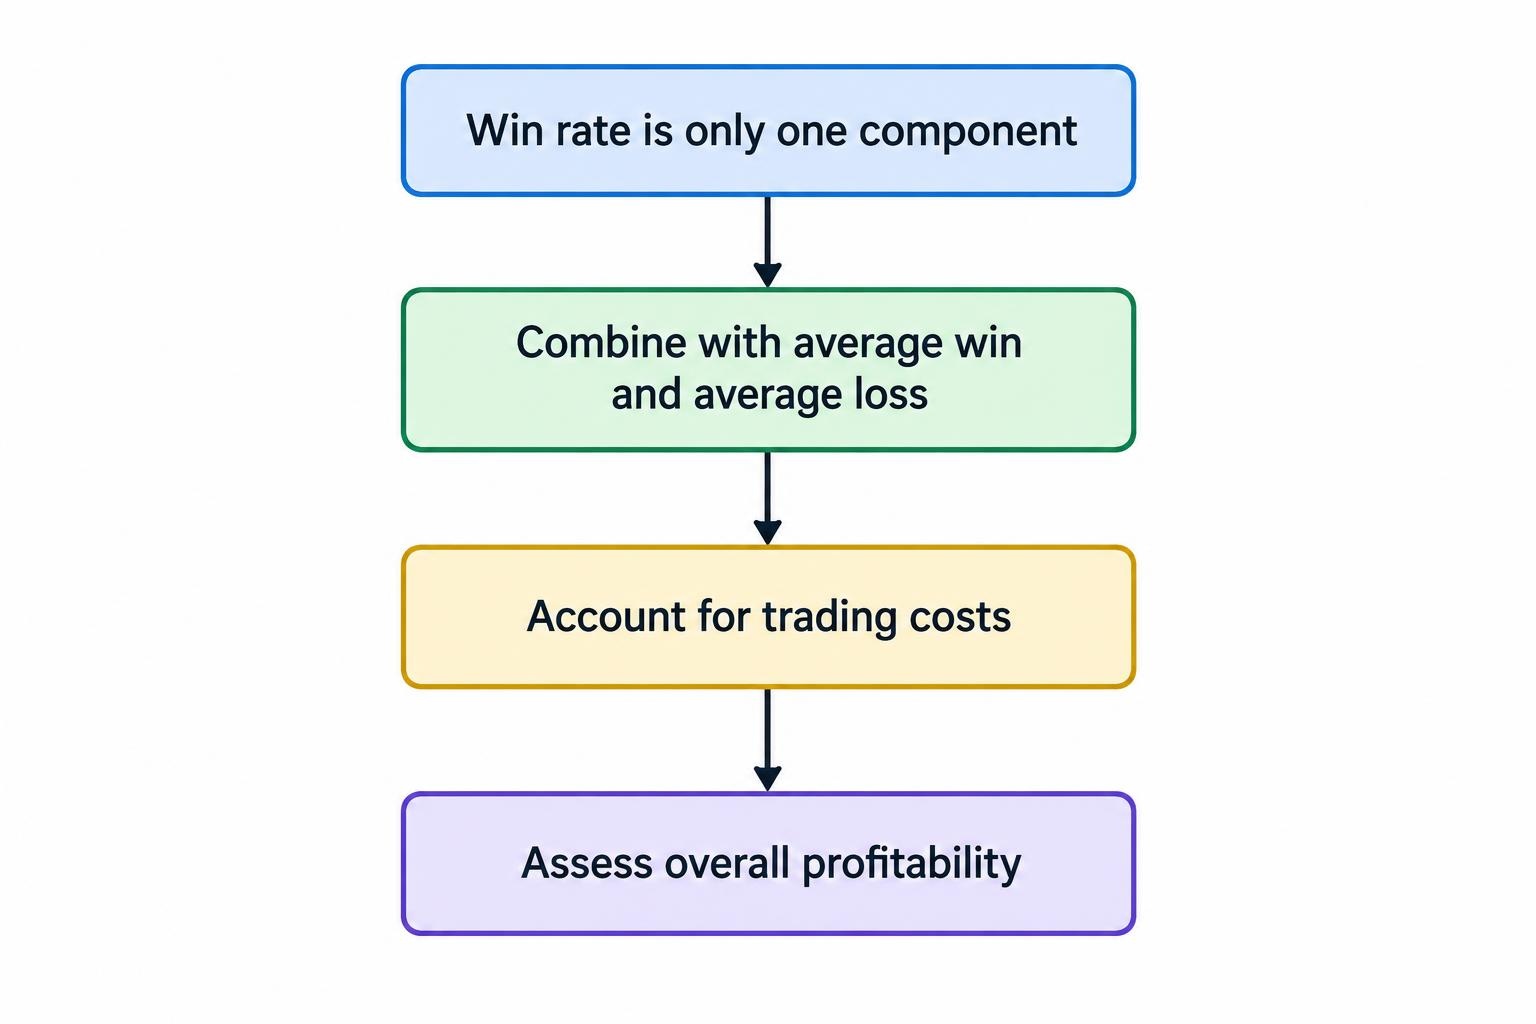
Win rate must be considered alongside average profit and average loss. For a simplified example, a strategy wins 80% of its trades, earning $10 each time, and loses 20% of its trades, losing $50 each time. Before costs, the average result per trade is zero: the frequent wins are exactly offset by the less frequent losses. If transaction costs apply, the result becomes negative. The example is arithmetic, not a prediction; it shows why a win percentage alone cannot establish profitability.
Look for the full distribution of results, not just the percentage of profitable trades. Average gain, average loss, largest loss, drawdown and exposure can show risks that a single headline conceals. A provider’s claimed hit rate also does not establish that the system will repeat its past results. For a broader discussion of how to assess trading outcomes, see trading performance measures beyond win rate.
How to examine a backtest
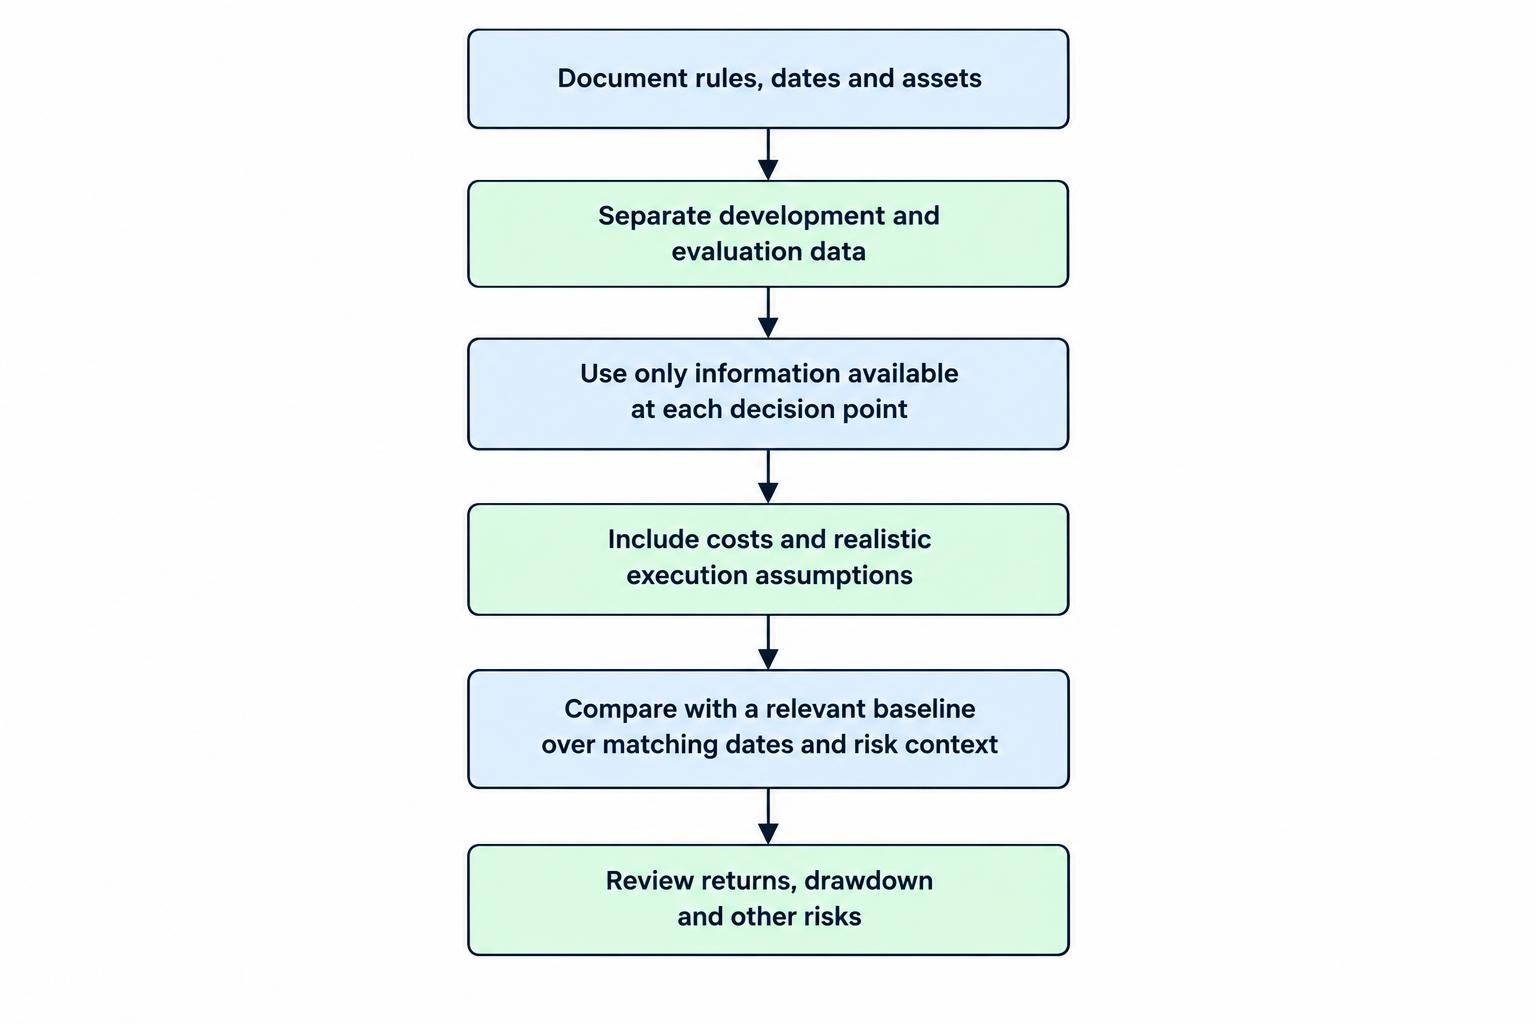
A credible backtest should make its method possible to inspect. Ask for the strategy rules, test dates, asset universe, data frequency and assumptions about order execution. For an AI model, ask what information was available when each decision was made, how the model was trained, and how parameters were selected. A chart showing a smooth rising balance cannot answer these questions. If the provider will show only a summary graphic or selected trades, you have little basis for evaluating the result.
Check whether historical data could have leaked information from the future into the model, whether the test includes securities that later failed or disappeared, and whether the strategy was tuned repeatedly on the same data. These problems can make a historical result look stronger than the approach would have been in real time. AI models can be especially flexible: testing many features, settings or strategies creates more chances to find a pattern that fits the sample by accident. Read more about overfitting, look ahead bias and data leakage before treating a strong result as meaningful.
Ask whether the provider separated data used for development from data used for evaluation. A test period only offers stronger evidence if it was not repeatedly consulted to choose the model or its settings. Better testing uses a pre-defined process that advances through time, with model decisions based only on information available at each point. It should report the results across test periods, not just the best-performing slice. Walk forward testing can help explain this approach, though no testing method removes market uncertainty.
Costs and execution assumptions matter. A backtest that ignores spreads, commissions, slippage or financing can overstate returns, especially for a strategy that trades frequently or aims for small price moves. Ask whether the test assumes it could buy or sell at the displayed price, whether it accounts for partial fills, and whether the required trade size could realistically be executed. A result before costs is not the same as a result after costs. The article on including trading costs in backtests covers the main assumptions to check.
Finally, compare the system with a relevant baseline. A profitable test may still be less attractive than a simple strategy or a passive benchmark over the same period and with comparable risk. The comparison needs matching dates, instruments and cost assumptions; otherwise it is not a fair test. Look beyond the final balance to drawdowns, volatility, concentration and the time taken to recover from losses. A comparison with simple rules and relevant benchmarks can reveal whether the model adds value beyond a favorable market period.
Questions to ask before trusting a backtest
| Question | What a clear answer should contain | Warning sign |
|---|---|---|
| Was this live or simulated performance? | A direct label and a description of how the result was produced. | “Real world results” with no account statements, execution details or method. |
| What period and instruments were tested? | Complete dates, the tested market and rules for selecting assets. | A short, cherry picked window or only the system’s best trades. |
| Were fees and execution costs included? | Assumptions for spreads, commissions, slippage and other applicable costs. | Gross returns presented as money an ordinary user could expect to keep. |
| Was the model tested on unseen data? | A clear separation between data used to build the model and data used to assess it. | Repeated testing and tuning until one result looked impressive. |
| What risks accompanied the return? | Drawdown, losing periods, position sizing and other relevant risk measures. | Win rate or total return presented without meaningful loss information. |
Paper results, live results and proof
Paper trading can show whether a strategy’s logic produces signals under simulated conditions. It may also help reveal operational issues, such as missed alerts or unclear rules. It does not prove that live orders will get the same prices, that a large order can be filled as modeled, or that the strategy will remain effective as conditions change. Treat paper performance as a test of process, not proof of future income. The guide to what paper trading can establish explains the distinction.
Live performance is more informative when it is complete, time stamped and independently verifiable. Ask whether results come from actual trades in an account, and whether the performance covers all relevant trades rather than selected winners. Screenshots and dashboards alone can be edited or simulated. Even genuine account records need context: account size, deposits and withdrawals, leverage, open positions, fees and the exact strategy used all affect how results should be interpreted.
Be wary of using a small live sample as proof of a dependable edge. A few profitable weeks do not establish that a model can handle different market conditions or a losing streak. Ask for performance over a meaningful span and whether the strategy rules changed during that time. If they changed, results from different versions should not be quietly combined as though they came from one unchanged system.
Why “guaranteed returns” deserve particular scrutiny
Trading systems can produce losses. A provider may state a target, estimate or hypothetical result, but that is not a guarantee that users will earn the same amount. Promises of high returns with little or no risk are recognized warning signs in investor protection materials. The SEC’s investor alert on AI and investment fraud specifically cautions against claims that AI can guarantee remarkable investment returns.
Look at how the promise is framed. “Consistent monthly income,” “never loses,” “risk free,” and “100% win rate” all call for evidence that a trading system cannot credibly provide in advance. The CFTC’s advisory on AI trading bots describes schemes that promoted bots with guaranteed returns and fabricated account balances. A polished dashboard, technical vocabulary or testimonials do not verify that trades occurred or that displayed profits can be withdrawn.
Inspect the entire offer, not just the performance claims. Who receives your money? Can you verify the company and the people behind it? Does the provider explain how its service earns revenue, what fees apply, and how withdrawals work? Be cautious if you are pressured to act quickly, asked to send funds to a personal account or digital wallet, or told to pay an extra “tax” or release fee before withdrawing. These are distinct issues from whether a model’s backtest is sound, but they matter when a seller is asking you to hand over funds.
Registration checks depend on the service and product being offered, and a registration record is not a performance endorsement. The SEC alert advises investors to check the background of investment professionals and investigate platforms before investing. If a provider claims that a regulator has approved its bot or guaranteed its results, confirm that claim directly with the regulator. Do not rely on a certificate, badge or registration number displayed only on the seller’s own site.
How to respond to a performance claim
Put the claim into writing before making a decision. Record the exact figure, the period covered, whether it is live or simulated, the costs included and the risks disclosed. Then ask the provider for the underlying method and supporting records. A reliable explanation should let you distinguish observed results from hypothetical ones. If the provider answers a question about drawdown with another win rate, or describes a backtest as “proven” without showing how it was run, the evidence is still missing.
Do not pay for a subscription, connect an account or deposit money just to find out whether a headline claim is true. Use a controlled evaluation process: verify the provider, understand the strategy and costs, and test only in a way that does not put money you cannot afford to lose at risk. If you use a paper account, remember that simulated fills do not settle questions about live execution. If a provider’s message sounds like a guarantee, you can also review the warning signs in this guide to recognising AI trading bot scams.
A strong performance claim is one that survives inspection, not one with the largest percentage. You should be able to tell where the number came from, what it leaves out and how much uncertainty remains. If the provider will not supply that information, treat the claim as unverified and keep your money out of the decision.