A backtest can make an AI trading system look precise, disciplined and profitable. It can also reward a model for learning quirks in historical data that will not repeat. The difference is whether the research process tests a trading idea fairly, with realistic data, costs and rules that would have been available at the time. A strong result is not proof that a strategy will make money. It is evidence to examine, challenge and compare with simpler alternatives.
Validation is the process of checking whether a model’s performance holds up beyond the data and decisions used to build it. That means separating model development from final evaluation, accounting for the many versions you tried, and checking how the strategy behaves in different market conditions. It also means testing the whole trading rule, not just the model’s predictions. If an AI forecast is accurate but arrives too late, triggers excessive trading or fails after costs, it may have little practical value.
What testing can and cannot establish
Testing can reveal bugs, data leakage, unstable signals, sensitivity to costs and poor performance outside the development sample. It can help compare a model with a benchmark under the same assumptions. It cannot certify future profits, prove that a historical pattern will persist, or remove uncertainty from markets. A model is judged on a sample of past conditions. Live trading introduces new observations, changing market behaviour, execution delays and operational failures.
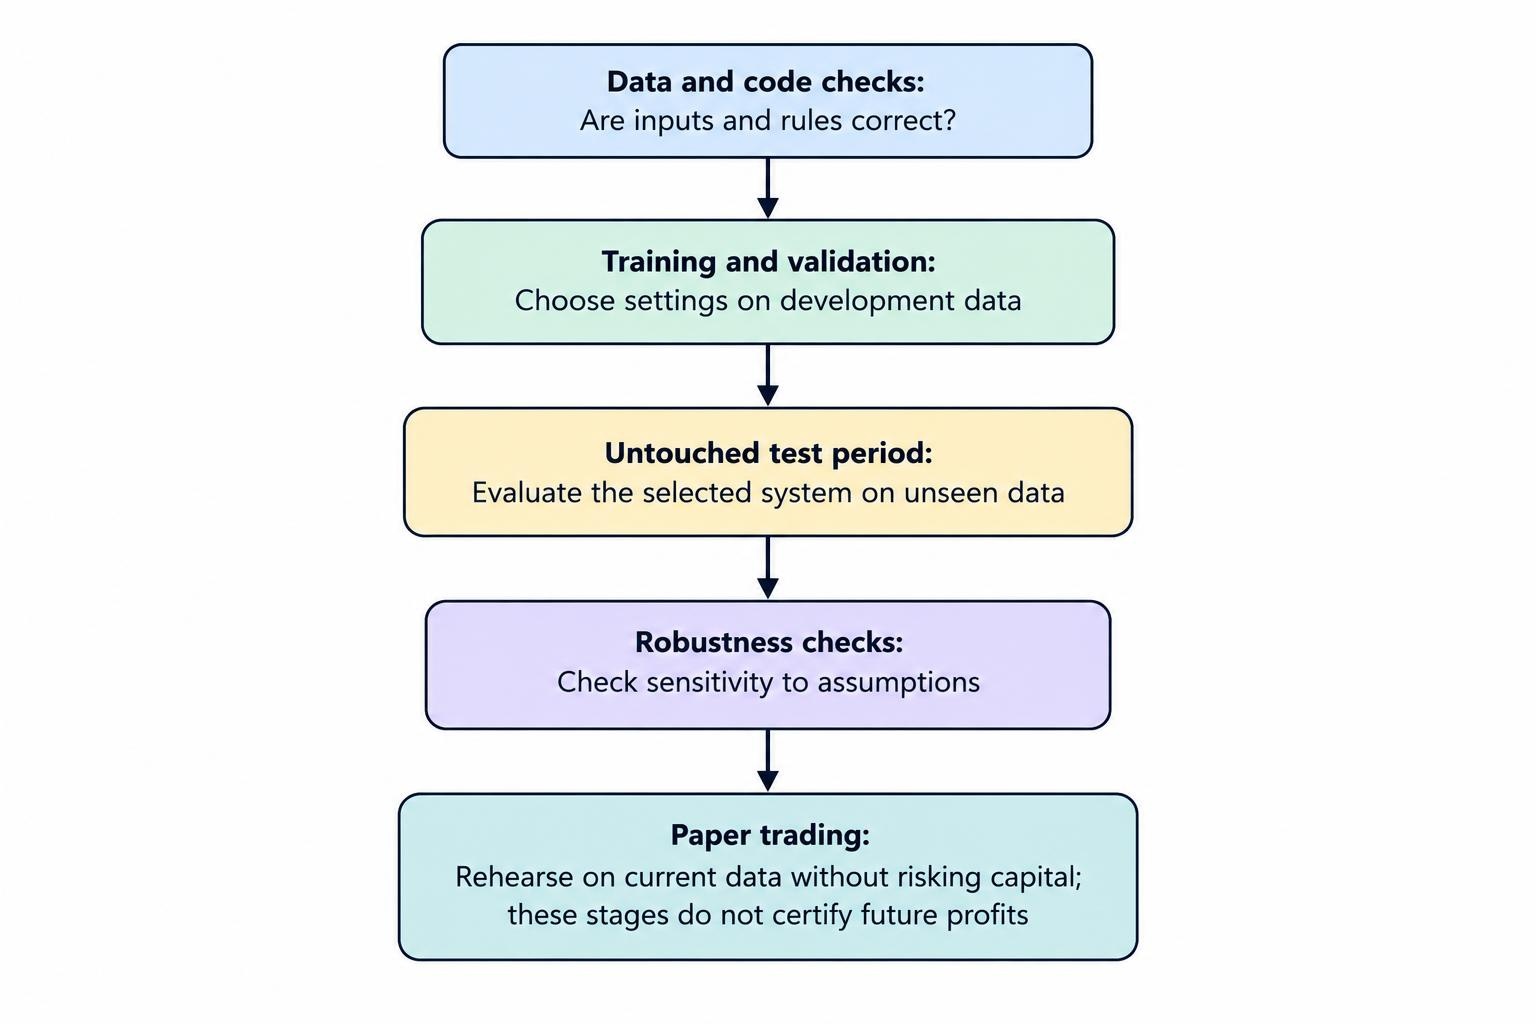
Keep four questions separate. Did the code do what you intended? Did the data represent what a trader could have known at the time? Did the strategy perform on observations that did not guide its design? Does the result remain useful under plausible costs and operating conditions? Each question calls for a different check. Passing one does not mean the others have been answered.
| Test stage | Main question | What it helps detect |
|---|---|---|
| Data and code checks | Are inputs, timestamps and trade rules correct? | Bad joins, wrong prices, execution timing errors |
| Training and validation | Which model settings work on development data? | Weak configurations and tuning mistakes |
| Untouched test period | Does the selected system work on data not used to choose it? | Some forms of overfitting and poor generalisation |
| Robustness checks | Does the result survive reasonable changes in assumptions? | Fragile parameters, cost sensitivity and regime dependence |
| Paper trading | Can the workflow operate on current data without risking capital? | Integration, timing and process issues |
Start with a testable trading rule
Before fitting a model, write down the intended use in plain language. Specify the market, instrument, timeframe, prediction target, signal threshold, entry and exit rules, position sizing, and conditions under which the system stays out of the market. “Predict the next move” is not a complete strategy. A test needs to say what counts as a prediction, when it becomes available, how it changes a trading decision and what price is used to simulate that decision.
Define the benchmark at the same time. Depending on the idea, it might be holding cash, buying and holding the asset, a simple moving average rule, or a non-AI version of the same strategy. The comparison should use the same dates, instruments, cost assumptions and risk limits. Without a benchmark, a profitable backtest may simply reflect a rising market or exposure to a familiar risk factor. Testing the system against a simpler rule is covered in more detail in AI strategy benchmarks and simple-rule comparisons.
Write down the intended experiment before reviewing final results. Record the target, features, data period, model family, tuning approach, trading rules and evaluation measures. This makes it harder to quietly revise the question after seeing which version performed best. It also creates a record of how many experiments were tried, an important detail because repeated testing increases the chance of selecting a winner by chance.
Check the historical data before modeling
Historical data is not automatically suitable because it is downloadable or looks tidy. Check timestamps, missing observations, duplicate records, currency units, corporate actions, contract changes and the treatment of assets that later disappeared. Prices may be adjusted or reported differently across vendors. A dataset that includes only instruments still active today can also omit failed or delisted instruments, making historical performance look better than the opportunity set really was.
Use information that would have been available at the moment of each simulated decision. This is a point-in-time requirement. If a company’s financial statement was published after the model’s signal date, its reported figures cannot be used as though traders already knew them. If a daily bar is only complete at the close, a strategy cannot use that final closing price and also claim to have placed an order before the close at that same price.
Build and inspect the data pipeline separately from the model. Confirm that records are sorted correctly, timestamps use the intended time zone, and every feature is aligned with the prediction date. Review random rows around market openings, holidays, missing values and major data updates. An apparently strong model can be a timestamp bug wearing a lab coat. More detail on source quality, adjustments and point-in-time data is available in the guide to preparing historical market data for AI research.
Split time series in chronological order
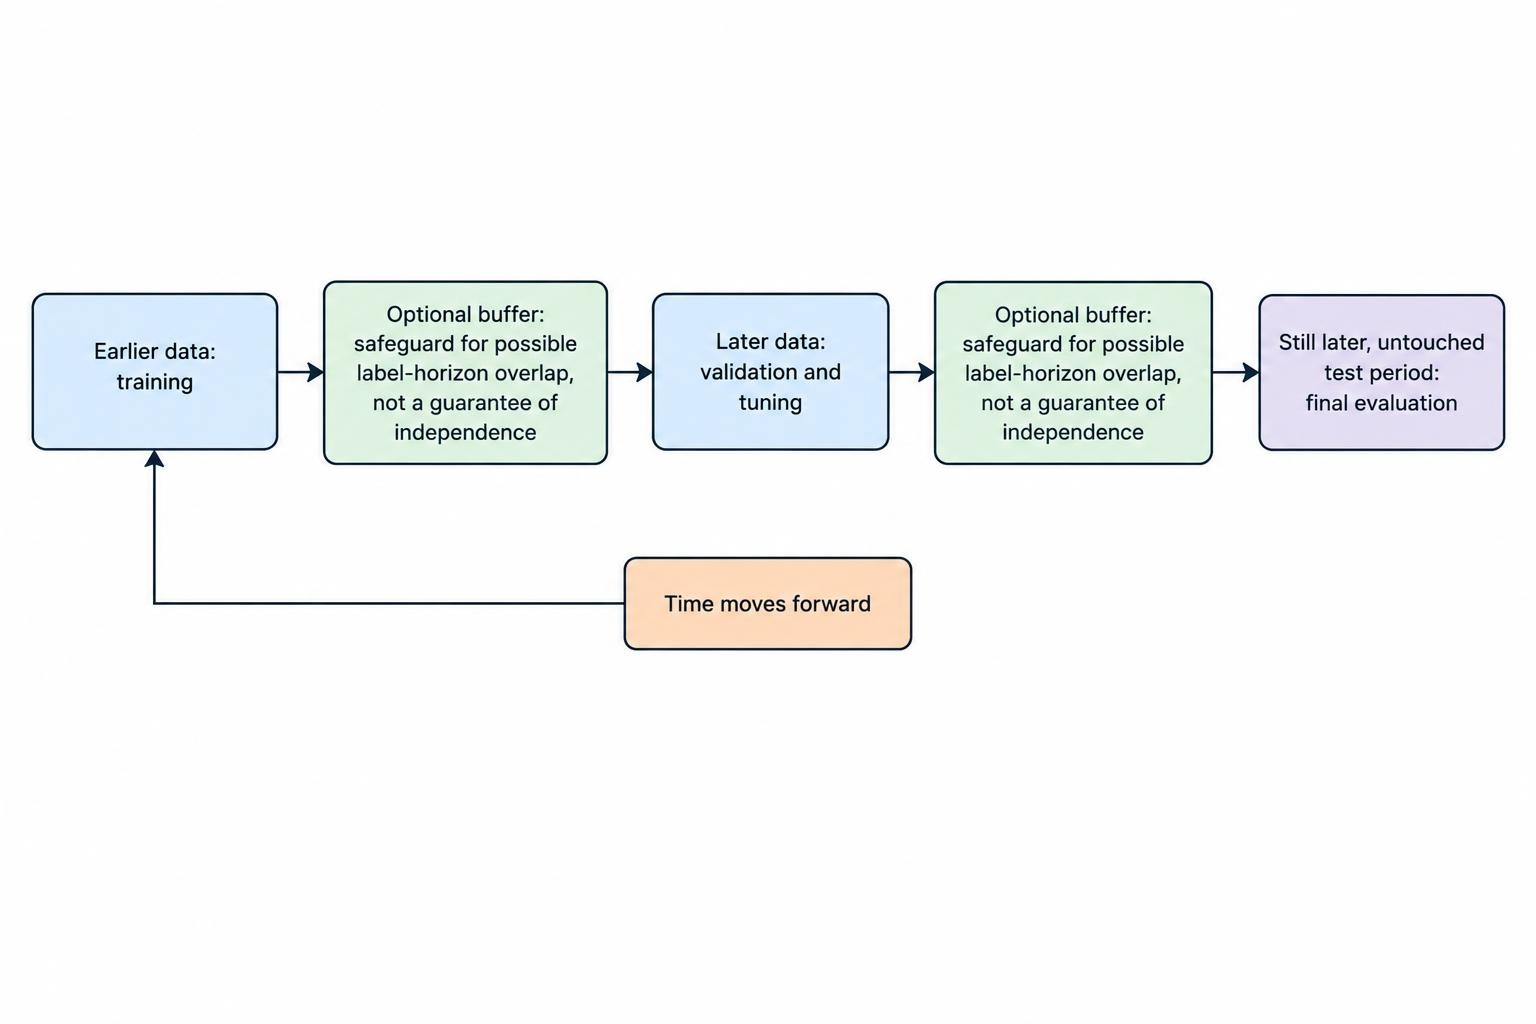
For market research, randomly shuffling observations between training and test sets can let information from the future influence a model tested on the past. A basic chronological split avoids that particular error: train on an earlier period, tune on a later period, and reserve a still later period for final evaluation. The exact date boundaries depend on the strategy and data, but the order must reflect the intended use.
Time series can require extra care around split boundaries. If a label uses returns over the next five days, training examples near the end of a period may overlap with observations in the next period. A buffer or gap can reduce this overlap. The required gap depends on the label horizon, feature construction and strategy. It is not a magic setting that guarantees independence; it is a safeguard to examine as part of the split design.
Walk-forward evaluation repeats the process across multiple chronological windows. A model is fitted using earlier observations, evaluated on the next period, then the window advances. This can show whether performance depends on one unusually favourable test period. It should not be used as a licence to keep adjusting the model after every disappointing window and report only the best result. The purpose is to assess a defined retraining process. See how to create training, validation and test sets for financial time series and how walk-forward testing evaluates a strategy over successive periods.
Some machine-learning tools offer time-ordered splitters, but the researcher still has to choose the right setup. The scikit-learn documentation for TimeSeriesSplit describes expanding training sets and an optional gap between training and test observations. Check that the tool’s behaviour matches the label horizon and trading schedule you actually use.
Keep the test set genuinely untouched
A test set is useful only if it did not influence choices made during development. If you inspect its results, alter features, retune thresholds and test again on the same period, that period has become part of the research process. It is no longer a clean final check. No code can undo that exposure. Preserve a final time period, record access to it, and use it once for the pre-specified evaluation.
This discipline matters even when the changes seem small. Trying several feature sets, model types, thresholds, assets or date ranges creates many chances to find a configuration that happened to fit historical noise. Research on backtest overfitting explains why the top result from a broad set of trials may perform poorly out of sample; see the paper “Statistical Overfitting and Backtest Performance”. Keep an experiment log that includes failed runs, not just the final candidate. If dozens of versions were explored, state that plainly when judging the strongest one.
Data leakage is a related failure: information from outside the training process finds its way into model fitting or evaluation. Leakage can occur through future prices, preprocessing performed on the full dataset, revised economic data, or features that encode the label indirectly. It may also happen when overlapping labels or duplicated records place near-identical examples in training and testing. The guide to overfitting, look-ahead bias and data leakage covers common ways this can distort a result.
Evaluate predictions and trading results separately
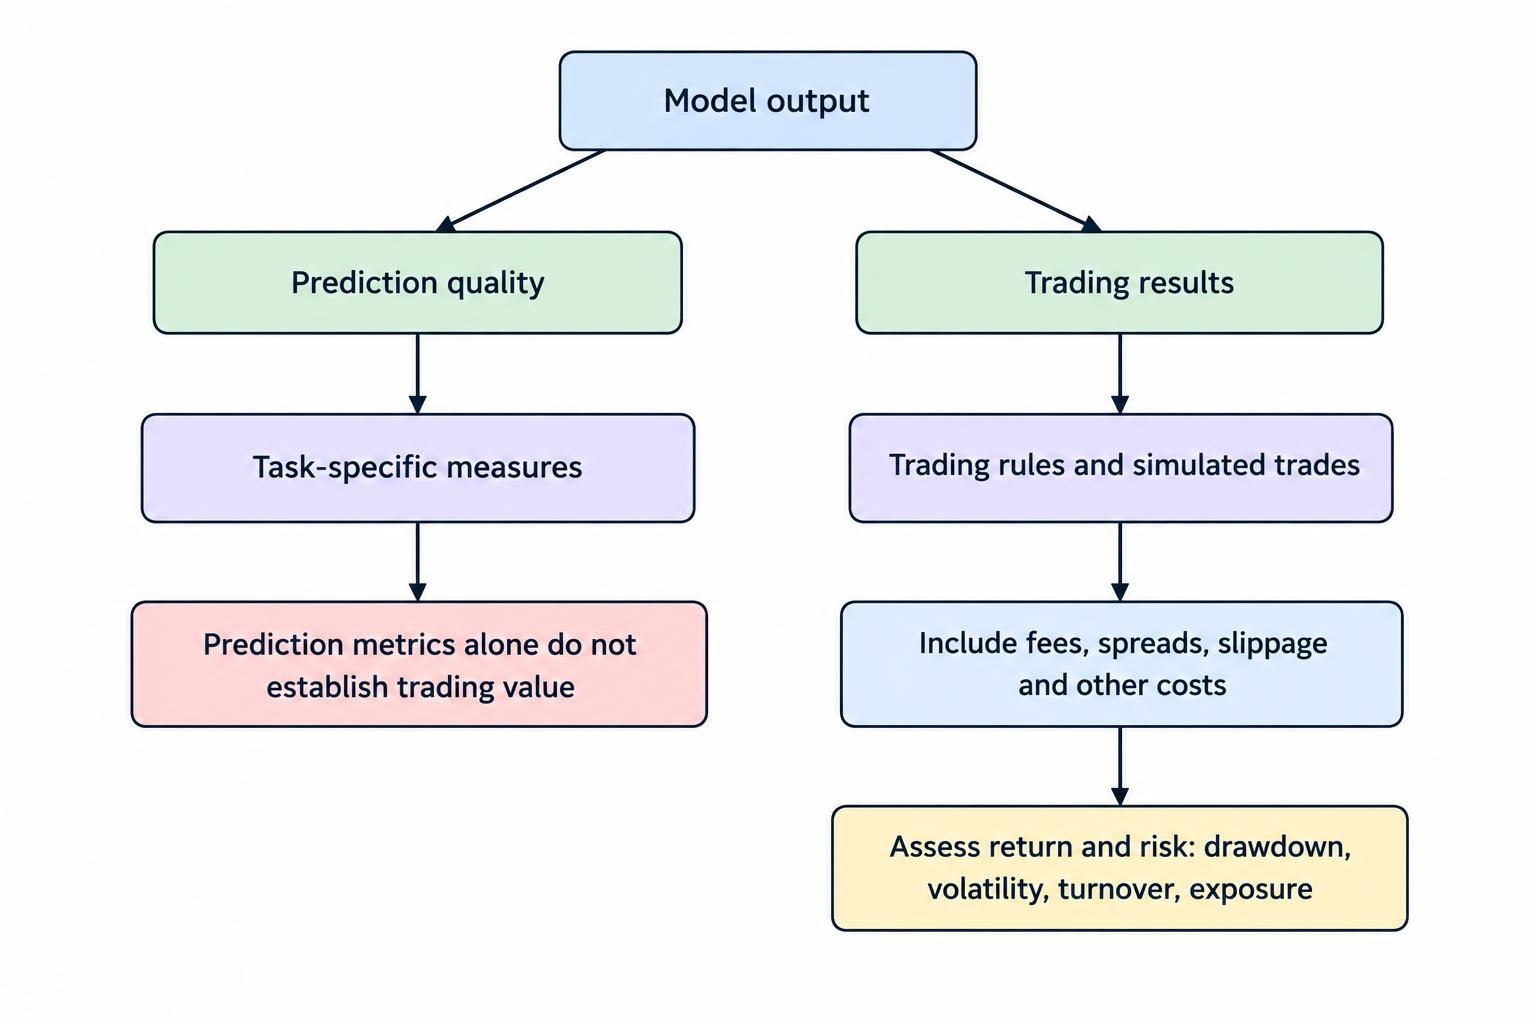
Prediction metrics and trading metrics answer different questions. Classification accuracy measures how often a label was predicted correctly, but it does not show whether the winning predictions were large enough to cover losses and trading costs. A model can be directionally right often and still lose money if its errors are costly. Conversely, a model with modest accuracy may be useful if its successful signals have favourable payoffs and the losses are controlled.
Choose prediction metrics that fit the target. A classification task might use precision, recall, calibration or a confusion matrix. A return forecast might use an error measure, but a small average error does not guarantee a useful trading signal. If the model outputs probabilities, check whether predictions assigned a given probability are correct at roughly that frequency in the evaluated data. Avoid treating a single score as a verdict.
Trading performance should include the complete return stream and relevant risk measures. Examine cumulative return, volatility, maximum drawdown, turnover and exposure, alongside win rate and average gain versus average loss. Results should also be broken down by time period and, where appropriate, instrument or market condition. A strategy that earns nearly all its gains in one short episode deserves closer scrutiny than a result spread across varied conditions. No metric can replace an inspection of the trades and assumptions behind it.
Apply fees, bid-ask spreads, slippage, financing and other relevant costs to simulated trades. Use assumptions that reflect the instrument and trading frequency, and test more than one plausible cost level where execution is uncertain. High turnover can erase a signal that looks attractive before costs. A model may also trade at prices that are unavailable in practice, particularly when it uses closing or intraday data. The dedicated guide to including fees, spreads, slippage and financing costs in backtests explains how these assumptions affect results.
Run robustness checks without tuning away bad news
Robustness testing asks whether the result depends on one narrow configuration. Change parameters modestly, shift the start and end dates, test nearby signal thresholds and inspect performance across different instruments or periods where the strategy is meant to apply. These checks should be defined as diagnostics, not a search for a new peak. If only one exact setting works and nearby values fail, the strategy may be fragile.
Market conditions change. A trend strategy may behave differently in a range, while a short-term signal may suffer when volatility rises or liquidity falls. Break results into sensible periods and examine whether the strategy’s expected behaviour appears in each. Avoid creating so many subgroups that one can always find a favourable slice. The aim is to identify dependence and failure conditions, not to make every chart look reassuring.
Check whether the result survives imperfect assumptions: delayed signals, less favourable execution prices, missing observations, lower position limits and a period of poor performance. Stress tests do not forecast exactly what will happen. They show how much the strategy relies on convenient conditions. For wider context, compare the tests with the planned guide to market regime detection and changes in trend, range and volatility.
Inspect the whole system, not only the model
A backtest often compresses a live process into a neat stream of simulated trades. Real systems also fetch data, calculate features, generate signals, size positions, submit orders and reconcile fills. Test those stages individually. Verify that a missing or stale data feed does not produce an unintended order, that a signal is not acted on twice, and that positions shown by the system match the account after partial fills or rejected orders.
Set limits before paper trading or live deployment. Specify maximum position size, daily loss threshold, allowed instruments, acceptable data age and conditions that stop new orders. Make sure a human can pause the system and inspect its status. Logs should record the inputs, model version, signal, order decision and execution result. These safeguards do not improve predictive performance, but they can limit the damage from a faulty process. The planned guide to trading limits, kill switches and human oversight covers operational controls in more detail.
Paper trading can check whether the workflow handles current data and simulated orders as intended. It can reveal timing mismatches, broken connections, unexpected signal frequency and differences between recorded prices and usable quotes. It cannot prove that simulated fills will match live execution, or that a strategy’s past performance will continue. Treat paper results as an operational rehearsal, not a guarantee. The guide to what paper trading can establish about an AI system sets out those limits.
Set criteria before reviewing the final result
Decide what would count as a pass before the final test is opened. Criteria might include positive performance after costs, a maximum tolerable drawdown, acceptable turnover, stability across evaluation windows, and no critical data or execution errors. The thresholds depend on the strategy and its purpose; there is no universal score that certifies an AI trading system.
If the system fails, record the failure and investigate its cause. Do not quietly change the rules and call the revised version validated by the same data. A revised model needs new evaluation data that has not guided its design, or a fresh testing process with the repeated experiments documented. If no untouched data remains, be clear that the latest result is developmental evidence, not a clean out-of-sample test.
Keep monitoring after deployment, because validation is not a one-time event. Compare live inputs and outputs with the conditions tested, watch for changing signal quality and check whether execution costs match assumptions. A shift in data, market structure or strategy behaviour may call for review, retraining or a pause. NIST’s AI Risk Management Framework includes ongoing monitoring and documented testing as parts of managing AI risks across a system’s lifecycle; its AI RMF core functions provide a general reference for that process.
A credible test report should make the research reproducible. Record data sources and dates, split boundaries, model and feature versions, trading rules, costs, benchmarks, metrics and every material experiment. Show weak periods as well as strong ones. State what was not tested. This does not make a strategy safe or profitable, but it gives a reader a fair basis for judging the evidence—and makes it harder for a lucky backtest to masquerade as a proven system.