AI-assisted day trading applies machine learning or other AI methods to decisions made within a single trading session. A model might rank stocks for review, estimate the chance of a short-term price move, or flag a possible setup. It can also send an alert or help route an order. None of those tasks guarantees that a trade will be profitable. Intraday signals have a short shelf life: a delay, stale quote, sudden spread change, or slow order fill can turn a plausible forecast into a poor trade.
The central challenge is coordination. A model must use data that was actually available at the time of its decision, produce a signal early enough to act on, and account for the price and costs of the resulting trade. A backtest that skips any of those details can make a strategy appear more reliable than it is. This guide focuses on signal timing, data quality, and execution constraints, within the broader work of developing and testing AI trading strategies.
What AI does in an intraday strategy
“AI day trading” describes a range of activities, not one method. A model can estimate whether a setup meets predefined conditions, sort a watchlist by a score, classify the market as trending or range-bound, or help a trader review a chart. Some systems send orders automatically; others leave the decision and order entry to a person. The distinction matters because a model’s forecast is not the same as a trading plan, and a trading plan is not the same as a completed order.
A useful way to define the model’s job is to ask what decision it must support. Does it identify symbols for review? Estimate a probability over the next five minutes? Decide whether an existing position should be reduced? Each question needs a target, a time horizon, and a rule for turning the output into an action. These are different tasks. A model that ranks securities well may still be poorly calibrated for estimating probabilities, while a forecast that is directionally right may offer too little movement to cover trading costs. More on the distinction between estimating prices, returns, direction, and probabilities is covered in the guide to choosing a prediction target for a trading model.
For a retail trader, an AI model often works best as one component in a defined process: it can screen, flag, or summarize, while separate rules govern position size, order placement, and when trading must stop. The right division of work depends on the trader’s setup and the system’s reliability. A plain-language overview of AI trading for retail traders can help distinguish model assistance from hands-off automation.
Signal timing: the forecast needs a clock
A day-trading signal is incomplete without a timestamp and a decision deadline. Suppose a model uses a one-minute candle. The candle’s closing price is only known after that minute ends, and the calculation takes additional time. A backtest that enters at the candle’s closing price assumes an order could be submitted at a price that was already formed using the close. In live conditions, the order arrives later. Depending on the instrument and order type, its fill may be worse, partial, or unavailable.
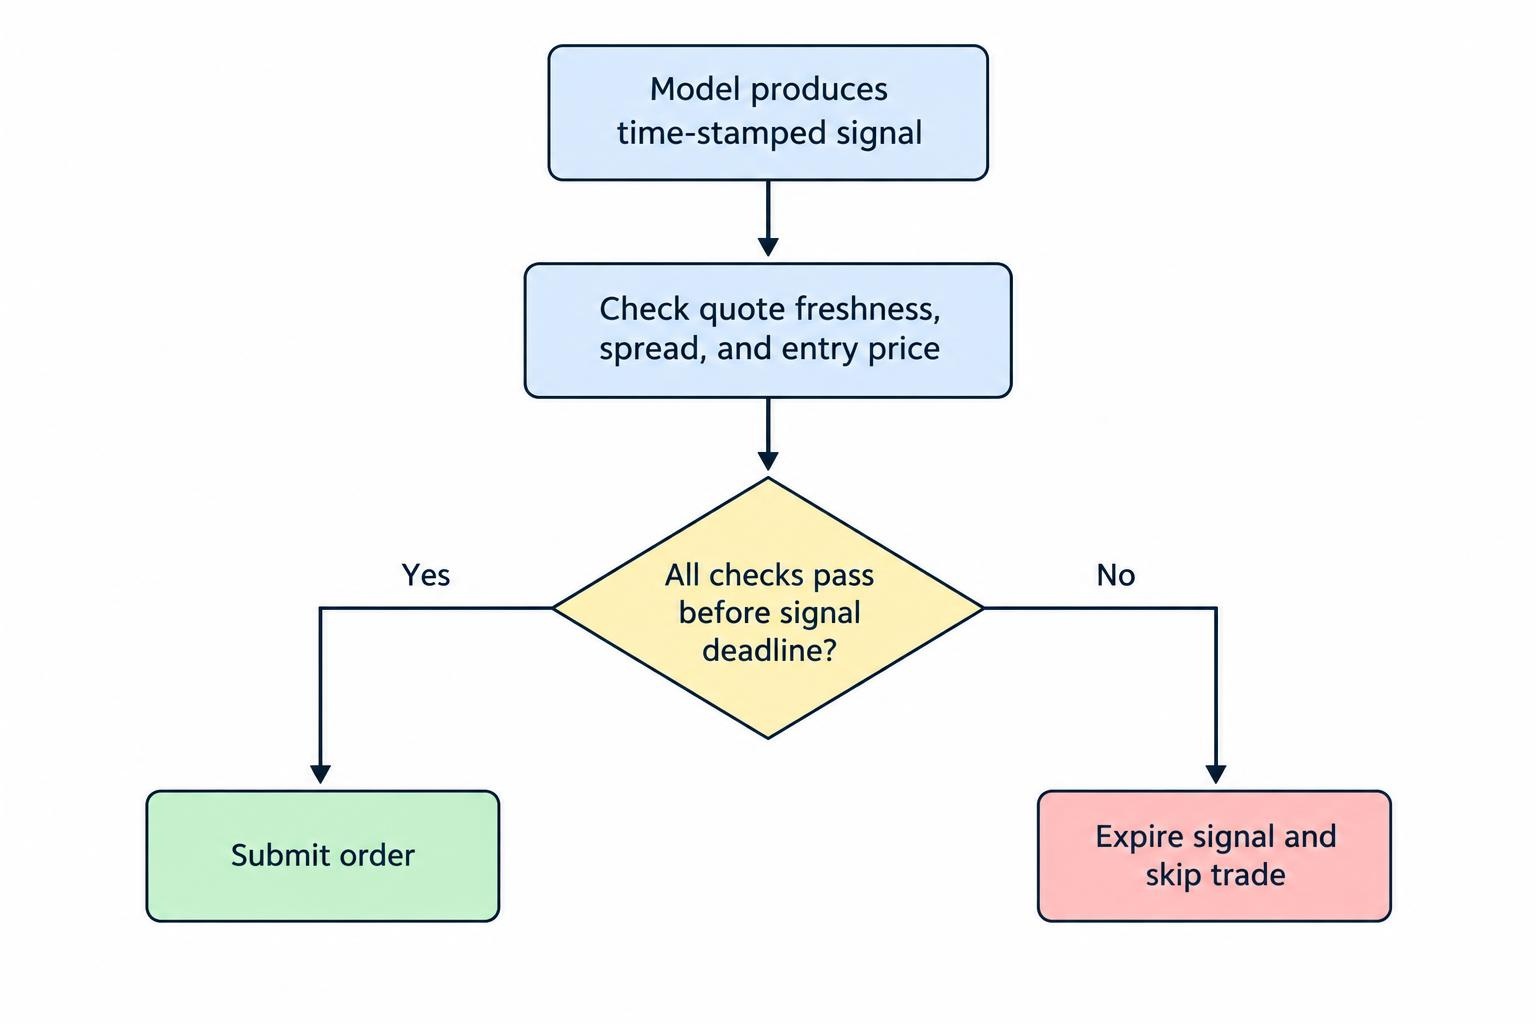
The model should therefore specify when its inputs are final, when it produces an output, how long the signal remains valid, and what event cancels it. If it produces a signal at 10:02:04, a rule might allow entry only if the market still meets stated spread and price conditions at 10:02:06. If those conditions fail, the system skips the trade rather than treating an old forecast as a standing instruction. A short deadline does not make a signal better; it prevents stale signals from being acted on as if nothing has changed.
Signal timing also affects how results should be evaluated. A forecast horizon might be one, five, or thirty minutes, but the expected holding period need not match it exactly. The strategy needs a clear entry rule, exit rule, and maximum holding time. Without these, a single predicted direction can lead to inconsistent trades: one operator may exit after a small reversal, another may hold until the close. Those are different strategies, even if they use the same model output.
Intraday patterns can also depend on the time of day. Opening activity, midday trading, and the final part of a session can have different levels of volume, volatility, and liquidity. A strategy should test these periods separately before assuming one threshold works equally well across the session. It should also account for exchange hours, holidays, early closes, and any pauses in trading relevant to the instrument. A clock mismatch between the data feed, model, and order system can create a signal that is technically valid but operationally mistimed.
Data quality: small errors can change the trade
Intraday data has several timestamps worth tracking: when an event occurred at the venue, when a vendor recorded it, when it reached the strategy, and when the model used it. These timestamps can differ. If the backtest sorts records by one clock while the live system acts on another, it may use information in an order that could not have occurred in practice. A strategy needs consistent time zones, clear rules for out-of-order events, and checks for missing or duplicated records.
Bars also hide detail. A one-minute bar provides an opening, high, low, close, and volume for that interval, but usually not the precise sequence of prices within it. If a backtest assumes a stop and a profit target were both reached during the same bar, the bar alone may not reveal which happened first. The test needs a conservative rule or more granular data; otherwise, it may give the strategy the more favorable outcome by accident.
Before modeling, inspect how the data handles bad ticks, gaps, split adjustments, trading halts, and symbols that change identifiers or leave a dataset. Confirm that volume fields have consistent meanings and that prices are aligned to the instrument and venue being tested. For multi-asset strategies, check that each market’s trading hours and timestamp conventions are represented correctly. A practical checklist for preparing historical market data for AI research is useful before building features or measuring performance.
Features require the same discipline. A rolling average, volatility estimate, or volume ratio must use only observations available at the moment the model is meant to act. A feature calculated with a full-day high or total volume cannot be used at noon unless the strategy is explicitly forecasting after the close. Normalize and transform data using the training period, then apply those fitted operations to later data. Calculating a scale or threshold from the full history leaks future information into earlier decisions. The guide to choosing features for a trading model covers how price, volume, volatility, and context can be defined without blurring those boundaries.
Build the test around time, not random shuffling
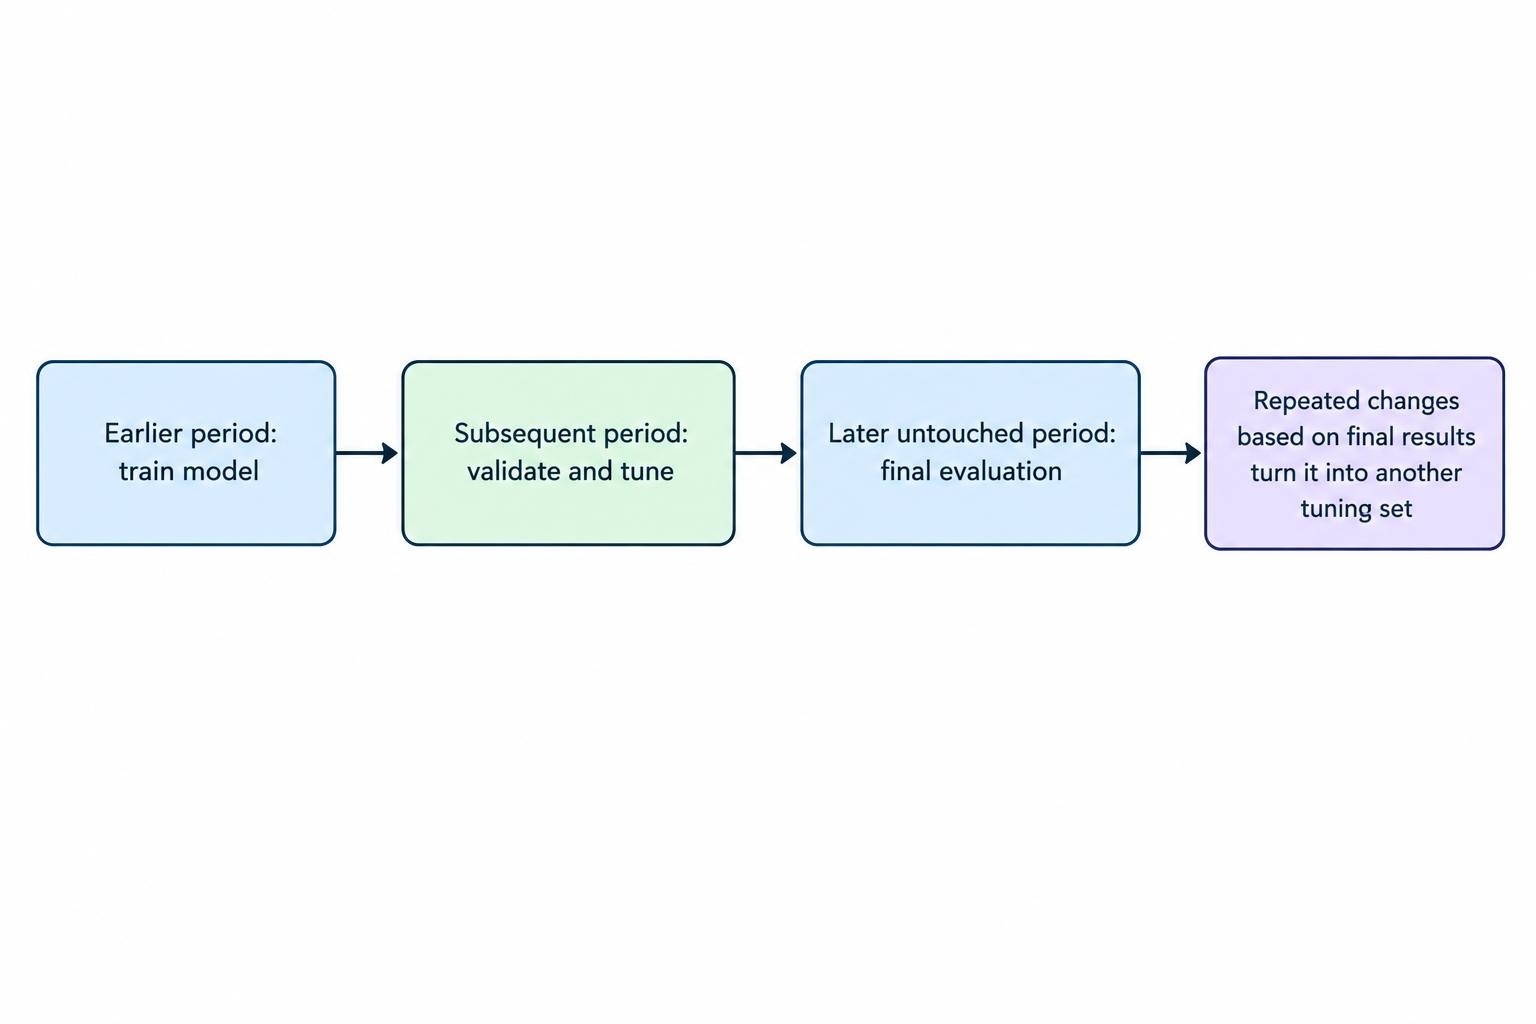
Financial observations have a time order. Randomly assigning one-minute records to training and test groups can put later market conditions into the training set while earlier records are used for evaluation. That does not represent a system trained on the past and used in the future. A chronological split is a more appropriate starting point: train on an earlier period, tune decisions on a later period, and reserve a final period that is not used to choose the model or its thresholds. The process for splitting financial time series into training, validation, and test sets explains why the ordering matters.
A rolling or walk-forward evaluation can better reflect repeated retraining. At each step, the model is fitted using the data available up to that point and then tested on the next period. The test must reflect the intended schedule: retraining each day, each week, or less often can produce different results. A gap between training and evaluation may also be needed when target labels overlap in time. Scikit-learn’s TimeSeriesSplit documentation describes chronological cross-validation and the option to leave a gap between samples; the appropriate setup still depends on the data and prediction horizon.
Repeatedly changing the model after looking at the final test period turns that period into another tuning set. Each change may seem modest—adjusting a threshold, removing a weak day, or trying a new feature—but the more choices are tested against the same history, the less independent the final result becomes. Keep a record of experiments and retain a genuinely untouched evaluation period where possible. A result that survives a fresh period is more informative than a chart of the best run among many attempts. See the guide to overfitting, look-ahead bias, and data leakage in trading models for common sources of inflated backtests.
Execution constraints: a signal is not a fill
A backtest often treats each order as though it filled at a convenient price. Live orders meet actual market conditions. A market order can fill at a different price than the last quote; a limit order can remain unfilled while the market moves away. Some orders fill only in part. The strategy should record the order type, intended price, submission time, fill time, filled quantity, and any remaining quantity that is cancelled or still open.
Spread, slippage, commissions, exchange or regulatory fees where applicable, and financing costs can erode small expected gains. Their effect is not constant: the spread may widen during a fast move, and a larger order may be harder to execute near the displayed price. A strategy that targets a small price movement is especially sensitive to these costs. Test costs under more than one assumption, including less favorable fills, rather than relying on a single ideal estimate. The guide to including fees, spreads, slippage, and financing in backtests provides a fuller treatment.
Liquidity and order size matter together. A backtest may show repeated entries at the same price even when the available quantity at that price could not fill all of them. For a small account, this may be less of a concern in a highly liquid instrument during active hours, but it should not be assumed away. Record the strategy’s order size and test whether the expected fill remains plausible at that size and time. If the model relies on a fill that is unlikely to occur, its simulated return is not a useful estimate of live performance.
Execution assumptions should match the actual broker connection and supported order types. If the system uses a limit order with a time limit, define what happens when the order only partly fills or remains open after the signal expires. If it uses a market order, define how much price movement is acceptable before the trade is abandoned. The connection between the model and the broker also needs its own checks; the guide to order types, partial fills, and position reconciliation covers those operational details.
Example: a signal that fails its own checks
Consider a hypothetical model that flags a stock after a short-term price increase and estimates the probability of a further rise over the next five minutes. The strategy does not buy automatically when the score crosses a threshold. It first checks whether the quote is current, the spread is below a preset ceiling, the market is open, and the price has not already moved beyond the intended entry range. If any check fails, the signal expires.
Suppose the model flags the stock, but the quote feed pauses briefly and the spread widens as the price jumps. The forecast may still point upward, but the trade no longer meets its entry conditions. Skipping it is not a failure of prediction; it is the strategy applying its execution rules. A useful system tracks these skipped signals separately from filled trades, since frequent skips may reveal that the model’s horizon, data feed, or trading assumptions do not fit together.
After entry, the strategy needs rules for exit and exposure. It might place a protective stop, a profit-taking order, or a time-based exit, with the exact choice specified and tested rather than added after a losing trade. It should also define the maximum position size and the daily loss limit. If a stop order is triggered in a fast market, its execution price may differ from the stop price; a stop is an instruction to act under defined conditions, not a promise of a particular fill. For more on structuring risk checks around model signals, see using AI as a trade filter instead of automating every decision.
Measure more than prediction accuracy
Classification accuracy can be misleading. A model may correctly predict the more common outcome while failing to identify the less frequent moves that make a strategy viable. It may also make many correct calls on tiny price changes and miss a few large adverse moves. Evaluate the output in the context of the trading rule: how many signals led to an order, how many orders filled, what was the return after costs, how large were losing periods, and how did results vary by session and market condition?
Keep forecast quality and trading performance distinct. Calibration asks whether events assigned a given probability occur at roughly that rate; a trading metric asks what happened after the probabilities were converted into entries and exits. A well-calibrated forecast can still fail as a strategy if the trades are costly or the risk is poorly controlled. Conversely, a profitable backtest over a short period does not establish that the model has a stable forecasting edge. The guide to measuring trading performance beyond win rate describes measures that capture more than the fraction of winning trades.
Compare the model with a simple baseline that uses the same data, trading hours, costs, and execution assumptions. Depending on the strategy, that may be a fixed rule, a no-trade baseline, or a straightforward benchmark. If a complex model does not improve on a simpler method out of sample, its added maintenance and failure points need a clear justification. Keep all comparisons on the same evaluation periods; changing the test window between methods can make one approach look better for reasons unrelated to the model.
Results should also be checked across distinct periods, not just aggregated into one attractive figure. Compare active and quiet sessions, different volatility conditions, and periods with wider spreads. A strategy that works only in a narrow slice of the data may still be useful under a tightly defined scope, but that scope must be explicit. A sharp decline in performance outside the selected period is a reason to investigate, not a reason to hide those observations from the report.
Paper trading and live monitoring
Paper trading can help test whether the data arrives on time, signals follow the intended rules, and orders are handled as designed. It cannot establish that live fills will match simulated fills. Some paper environments do not reproduce queue position, market impact, partial fills, or every broker-side constraint. Treat simulated results as an operational check and another source of evidence, not a guarantee that real money will produce the same outcome. The guide to what paper trading can establish about an AI system explains the difference.
During any trial, log each decision and its inputs: the timestamps, model version, feature values, forecast, rule checks, order request, acknowledgements, fills, and cancellation reason. If the strategy behaves unexpectedly, these records make it possible to distinguish a bad forecast from stale data, a software fault, or an execution issue. A system should also alert the operator when it loses its data feed, stops receiving order acknowledgements, or exceeds a defined limit. For automated strategies, define how the system is stopped and who can restart it; kill switches, trading limits, and human oversight should be part of the design before deployment.
Live monitoring remains necessary even after a system has passed testing. A model can encounter conditions that were rare or absent in its training data, and a change in market behavior can weaken a previously useful signal. FINRA’s report on AI in the securities industry notes that unusual conditions outside training data can affect model reliability and may lead to undesirable trading behavior. For an individual strategy, the practical response is to monitor data health, execution quality, losses, and changes in the distribution of model inputs, with clear rules for pausing or reviewing the system.
Limits and safeguards for retail traders
Frequent trading demands attention and can bring higher costs; margin can also magnify losses. FINRA’s overview of frequent intraday trading describes those risks, along with account and margin considerations for U.S. securities traders. Account terms and rules can vary, so check the requirements that apply to the account and instruments being used. An AI score does not change the financial risk of a position or make a strategy suitable for money needed for living expenses.
Be cautious of products that promise reliable returns or claim that an AI bot can trade without meaningful oversight. FINRA warns that auto-trading promotions may exaggerate AI capabilities, present unsupported performance claims, or request sensitive account credentials. A provider should be able to explain what the system does, how its performance was measured, what access it requires, and how a user can monitor or stop it. FINRA’s discussion of auto-trading services outlines warning signs and checks for retail investors.
For an independently developed strategy, a prudent progression is to test the data and rules, evaluate out of sample, compare with a basic baseline, and paper trade while checking the actual workflow. If the system is later used with real funds, start within predefined limits that the trader can afford to lose and retain a clear manual stop procedure. The main standard is not whether the model sounds advanced. It is whether the complete process—data, timing, signal, order, costs, and controls—has been specified and tested well enough to understand where it can fail.