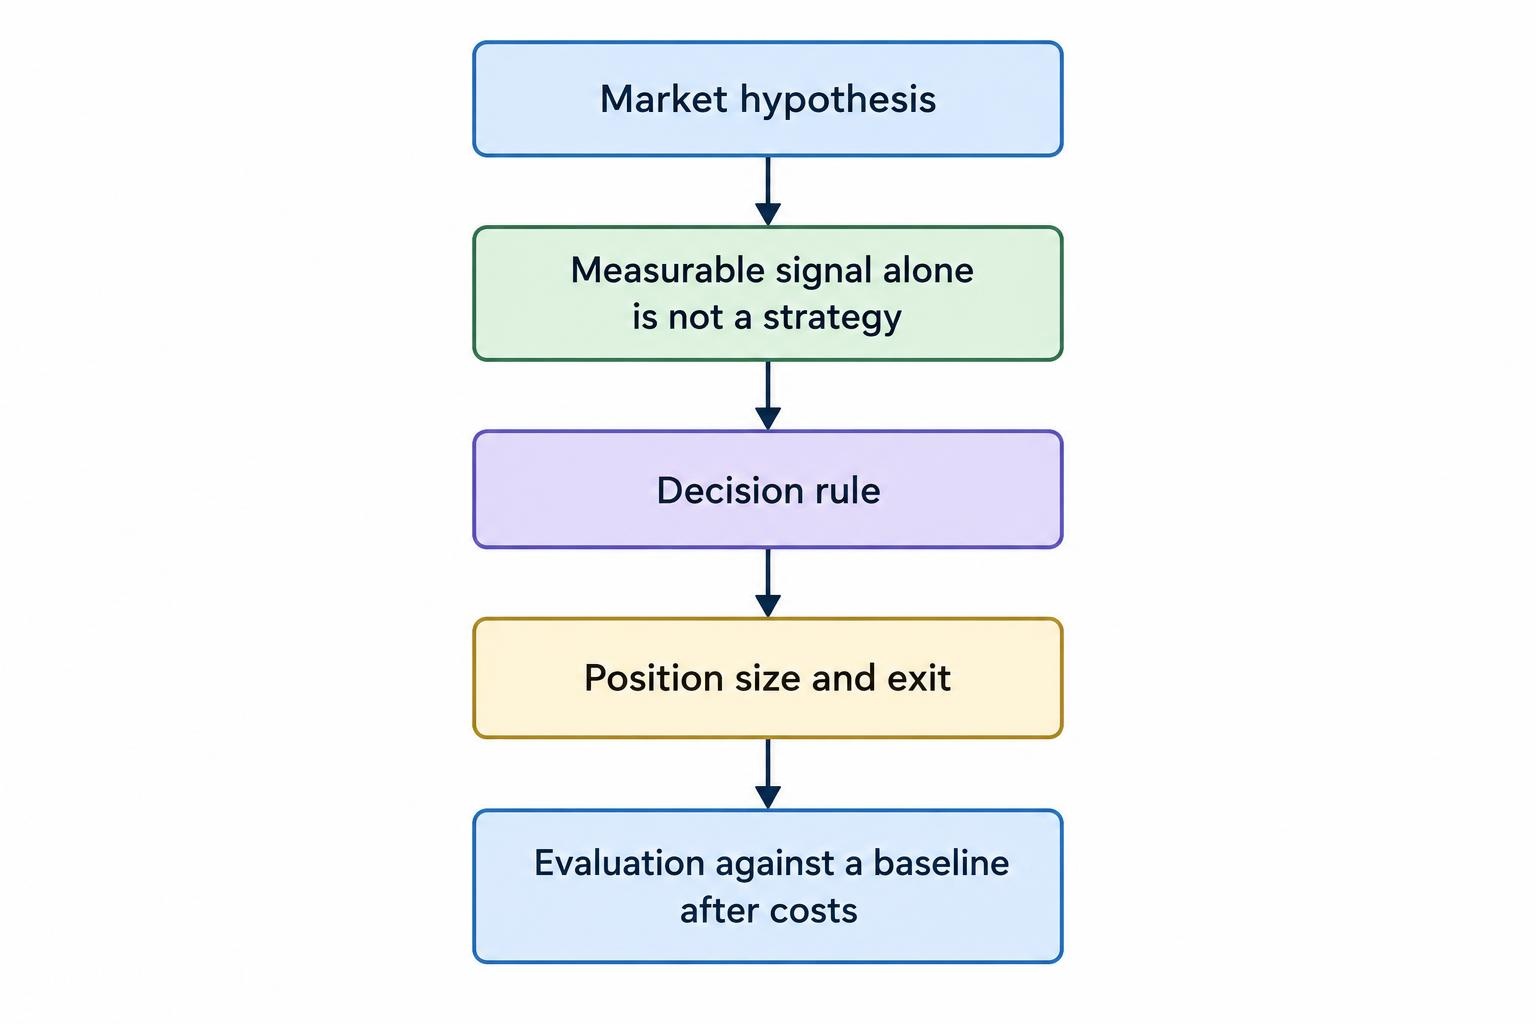
An AI trading strategy is a set of rules for turning market information into a decision. The model may rank possible trades, estimate a probability, identify a market condition or filter signals from a simpler strategy. None of those outputs is a strategy by itself. A usable strategy also defines when to act, how much exposure to take, when to exit and what to do when data or execution fails.
Signal development is the process of turning an idea into a measurable input to those rules, then testing whether it adds value beyond a simple baseline. The goal is not to find the most complicated model or the prettiest backtest. It is to make the hypothesis, data, decision rule and evaluation clear enough that another person could reproduce the test.
Separate the hypothesis, signal and trading rule
Start with a market behavior you can describe without referring to a particular model. A trend hypothesis might be that an asset’s recent direction tends to persist over a defined horizon. A mean reversion hypothesis might be that unusually large short term moves are followed by partial reversals under certain conditions. These are research questions, not promises of future returns. For background on those strategy families, see the guides to AI trend following and AI assisted mean reversion.
Next, define a signal that could support or weaken the hypothesis. It might be a rule based measurement, a model score, or an estimated probability. Then define how that value changes a position. A high score could allow a trade, reduce an existing position, or do nothing unless a separate condition is met. This distinction matters: a model that predicts a small positive return does not automatically imply that buying is worthwhile after costs and risk are considered.
| Part of the strategy | Question to answer | Example |
|---|---|---|
| Hypothesis | What market behavior might exist? | Recent price strength may persist over a chosen horizon. |
| Signal | What observable value represents that idea? | A model estimates the probability of a positive return over the next five sessions. |
| Decision rule | What must happen before the system acts? | Consider a long position only when the probability exceeds a prespecified threshold. |
| Position and exit | How much exposure is taken, and when is it closed? | Set a maximum position size and close after a fixed period or a defined exit condition. |
| Evaluation | How will the complete rule be judged? | Compare after costs with a simple baseline on data not used for model selection. |
Write these parts down before tuning a model. Otherwise, every disappointing result invites a new explanation: a different indicator, holding period, asset list or threshold. That flexibility can turn research into a search for a historical accident. A written specification keeps the question stable while the model is tested.
Choose a prediction target that matches the decision
Models can be built to predict future prices, returns, direction, volatility or the probability of an event. These targets are not interchangeable. Predicting a price level may look impressive because prices often move gradually, yet the forecast can still be poor at identifying profitable entry decisions. Predicting direction may be more directly relevant, but it ignores the size of gains and losses. A probability forecast can help set a decision threshold, provided it is calibrated and evaluated over the same horizon used by the trading rule.
Specify the asset, forecast horizon and outcome before choosing a model. If the intended holding period is several days, a label based on the next few minutes answers a different question. Be equally precise about what counts as a positive outcome. A return before trading costs can be positive while the trade is unattractive after spread, fees, slippage or financing. The guide to prediction targets in trading models covers the distinction between forecasting prices, returns, direction and probabilities.
Classification models assign observations to categories, such as positive or negative forward return. Regression models estimate a number, such as a future return or volatility value. Ranking models sort assets or opportunities from stronger to weaker. A model can also estimate whether a separate strategy’s signal should be accepted. Each approach answers a different question, so choose it based on the decision rule rather than its popularity or technical appeal.
Suppose a model estimates the chance that an asset will rise over the next five sessions. The strategy still needs to define what probability is high enough, whether a short position is allowed, how long the position can remain open and what to do if the forecast changes the next day. These rules are part of the strategy, not minor implementation details. Adjusting them after seeing test results also counts as model selection.
Build features from information available at decision time
Features are the inputs a model uses to produce its signal. They can describe recent returns, trading volume, volatility, price location, calendar effects or conditions in related markets. The central requirement is simple: each feature must be available at the time the strategy would make its decision. A value calculated with a day’s closing price cannot be used to simulate a trade placed earlier that day unless the test accounts for when that closing value became known.
Start with a small set of features tied to the hypothesis. For a trend idea, that might mean recent returns over prespecified horizons and a measure of current volatility. For a reversal idea, it could include the size of a recent move and whether volatility is unusually high. Adding more variables can let a model represent richer relationships, but it also increases the number of possible patterns it can fit to historical noise. A feature should have a reason to be present, not just a promising correlation in one sample.
Market context can help a signal behave differently under different conditions. A strategy may use a trend signal only when a separate measure suggests that prices are moving persistently, or reduce exposure when volatility rises. That does not mean a regime label is automatically reliable: the method needs to define how regimes are identified and how decisions work when conditions change. See market regime detection and feature selection for trading models for those design questions.
Keep the feature calculation consistent across research and live use. Record how missing observations are handled, when data is timestamped and whether values are revised later. Historical company data, for example, can reflect information that was not available to a trader on the date being simulated if the dataset omits publication timing or later corrections. A model cannot repair a dataset that quietly gives it tomorrow’s information.
Match the strategy family to the market idea
Trend following, mean reversion and event or context based strategies can all use AI, but the model’s role differs. It might estimate trend strength, score a reversal setup, rank assets or reject signals that appear weak. Begin with the simplest rule that expresses the hypothesis. Then test whether the model improves a specific part of the decision process, rather than comparing an AI system only with doing nothing.
There is published research documenting time series momentum across futures markets, including equity index, currency, commodity and bond futures. That is evidence about a set of historical markets and a defined research design; it does not establish that a new AI model, instrument or time period will behave similarly. The time series momentum study in the Journal of Financial Economics offers one reference point for trend research, not a shortcut around testing a new strategy.
Mean reversion systems need a clear account of what makes a move unusual and what would invalidate the reversal idea. A price that has fallen sharply can keep falling. A model that labels it “oversold” is describing a feature, not establishing that a rebound is due. A strategy can use a filter to avoid taking every apparent setup, but the filter must be tested as part of the full rule, including missed trades and losses when the filter fails.
For swing or day trading, timing and data granularity add practical constraints. A signal calculated from delayed or incomplete data may arrive after the price move it was meant to capture. The faster the intended decision, the more carefully the test must model timestamps, spreads, order timing and execution assumptions. A forecast with a useful statistical relationship can still be too late or too small to trade. The cluster guides to AI assisted swing trading and AI assisted day trading address those different constraints.
Use AI as a filter when a full model is not justified
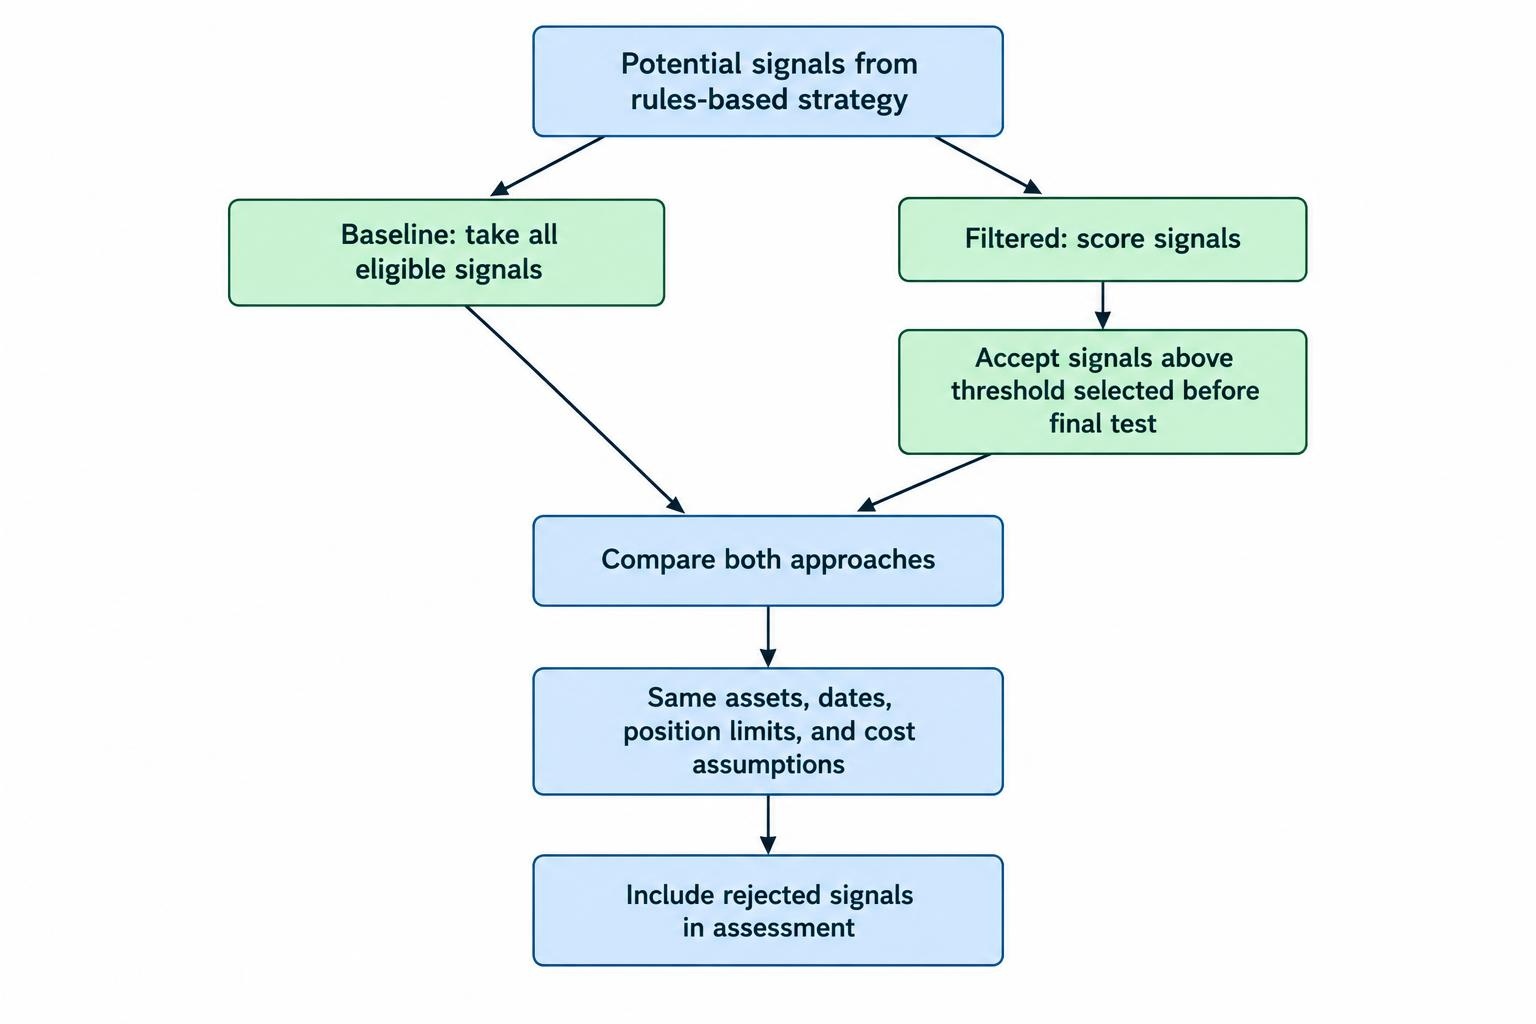
A model does not need to generate every entry and exit. It can filter a strategy’s existing signals, estimate whether a setup meets defined conditions, or flag unusual data for review. This narrower role can make the research question easier to test: does the filter improve decisions compared with taking all otherwise identical signals? The comparison should include the trades rejected by the model, not only the successful trades it allowed through.
For example, a rules based strategy could generate potential entries, while a separate model assigns each one a score. The researcher can compare the original strategy with a version that accepts only signals above a threshold fixed in advance. The threshold must be selected using training or validation data, not repeatedly adjusted after inspecting the final test period. If several thresholds, models and feature sets are tried, the selection process itself can create an apparently strong result by chance.
There is a useful difference between improving prediction and improving the trading decision. A model may reduce forecast error without improving results under the chosen position and exit rules. Conversely, a modest forecast can sometimes help when it changes which trades are taken. Judge the signal by its contribution to the complete strategy, not by a standalone accuracy score. The guide to using AI as a trade filter focuses on this narrower approach.
Evaluate the complete strategy, not an isolated signal
Build a simple baseline before adding complexity. Depending on the question, that could be a fixed rule, a basic trend or reversal measure, a passive position or the same strategy without the AI filter. The comparison should use the same assets, dates, position limits and cost assumptions. If the AI version wins only because it uses different exposure or avoids inconvenient periods, the test does not isolate what the signal contributed.
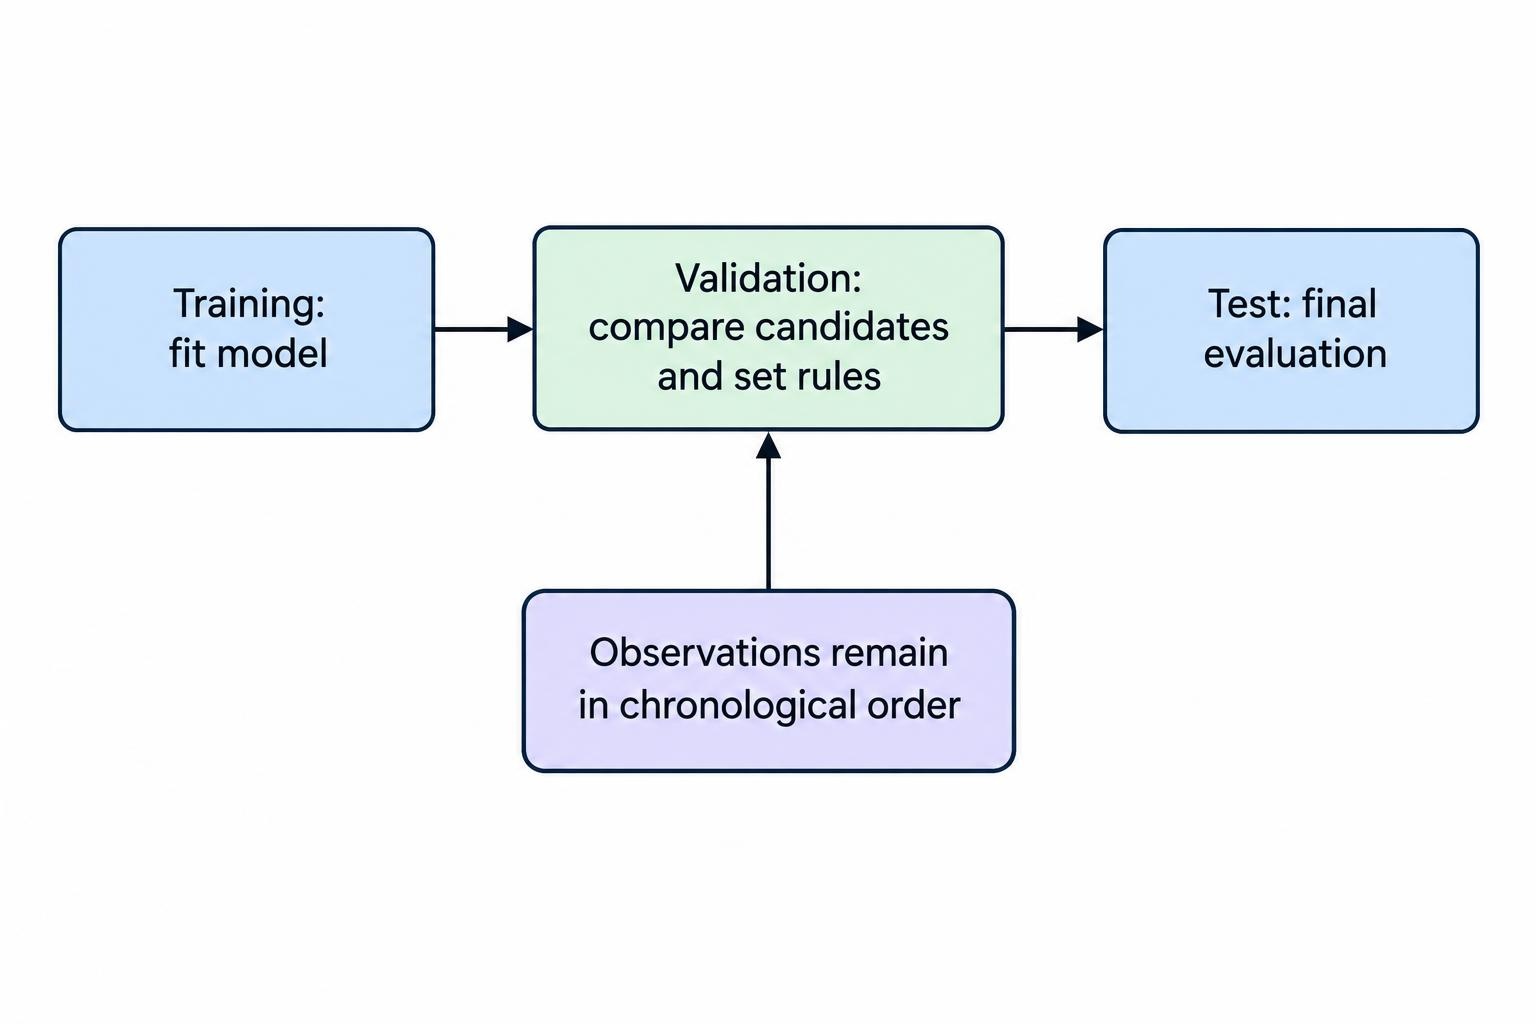
Keep training, validation and test periods separate. Use training data to fit model parameters, validation data to compare candidates or set rules, and reserve the test data for a final evaluation. In time series, preserve the order of observations; random shuffling can allow information from later periods to influence a model evaluated on earlier ones. When training labels overlap in time, the split design may also need to prevent information from an outcome period leaking across the boundary.
A single holdout period is not a guarantee. If many strategies are tested and only the strongest result is reported, the winner may reflect chance and repeated selection. Research on the backtesting of strategies based on multiple signals discusses the risks of testing combinations of investment signals, while work on the probability of backtest overfitting proposes methods for assessing how selection can produce misleading results. The practical lesson is to keep a record of attempts, not just the final candidate.
Test the strategy across more than one market condition and report how results vary. A strong average can conceal dependence on a short period, one asset or a small number of trades. Walk forward testing, where a model is refit using past data and assessed on later data in sequence, can show how performance changes through time. It does not prove future success, but it gives a more realistic view of repeated use than fitting once to the full history.
Include realistic fees, spreads, slippage and any relevant financing cost in the simulated result. Consider what happens when execution is delayed, a trade is partially filled or a market has poor liquidity. Check whether the signal still contributes when costs are increased, position sizes are reduced or thresholds are changed modestly. If a tiny change destroys the reported advantage, the strategy may depend on fragile tuning rather than a stable effect. For detailed test design, see testing and validating AI trading systems.
Keep a research record and set a stopping rule
Record each meaningful experiment: the hypothesis, dataset version, features, model settings, decision rules, cost assumptions and results. Include failed versions. A log makes it harder to forget how many alternatives were tried, and easier to distinguish a new test from a result that has already influenced later choices. This matters even when the experiments are informal; changing a threshold after looking at results is still a form of selection.
Set conditions for rejecting a strategy before the final test. Those conditions might include a minimum sample size, stability across periods, performance relative to a baseline, or failure under plausible cost assumptions. A strategy that fails a prespecified test should not be rescued by repeatedly changing the rules and presenting the revised result as if it were the original hypothesis. If the idea changes, treat it as a new candidate and validate it on data that has not already guided those changes.
Keep claims proportional to the evidence. A backtest describes a simulation under its data and assumptions; paper trading can reveal workflow and execution issues, but it does not establish how a strategy will perform with live orders. An AI generated signal is a research output, not proof of an edge. The useful product of signal development is a transparent decision rule whose limitations, test history and operating assumptions are known.