Leverage and correlation can make an AI trading account riskier than its position list suggests. A model might spread trades across several symbols, strategies or timeframes, yet still concentrate them in the same underlying market exposure. Add borrowed funds or derivative exposure, and a modest price move can produce a large account loss. The risk is easy to miss if each bot is reviewed on its own: a portfolio can hold several individually reasonable trades that all depend on the same market moving in the same direction.
The practical task is to measure what the account would lose under a shared adverse move, not to count how many positions or algorithms are running. That means looking through strategy labels to the assets, risk factors, order sizes and exit conditions beneath them. It also means testing what happens when correlations change, liquidity thins or a broker reduces available margin. AI can help organize those checks, but it cannot make leverage safe or diversification permanent.
Leverage magnifies exposure, not the quality of a signal
Leverage lets a trader control exposure larger than the account capital committed to it. It may come from borrowing in a margin account, using futures or options, trading contracts for difference where available, or opening leveraged foreign exchange positions. The exact mechanics differ by product and account. The shared effect is that a price move is applied to a larger exposure relative to the trader’s capital, increasing both potential gains and losses.
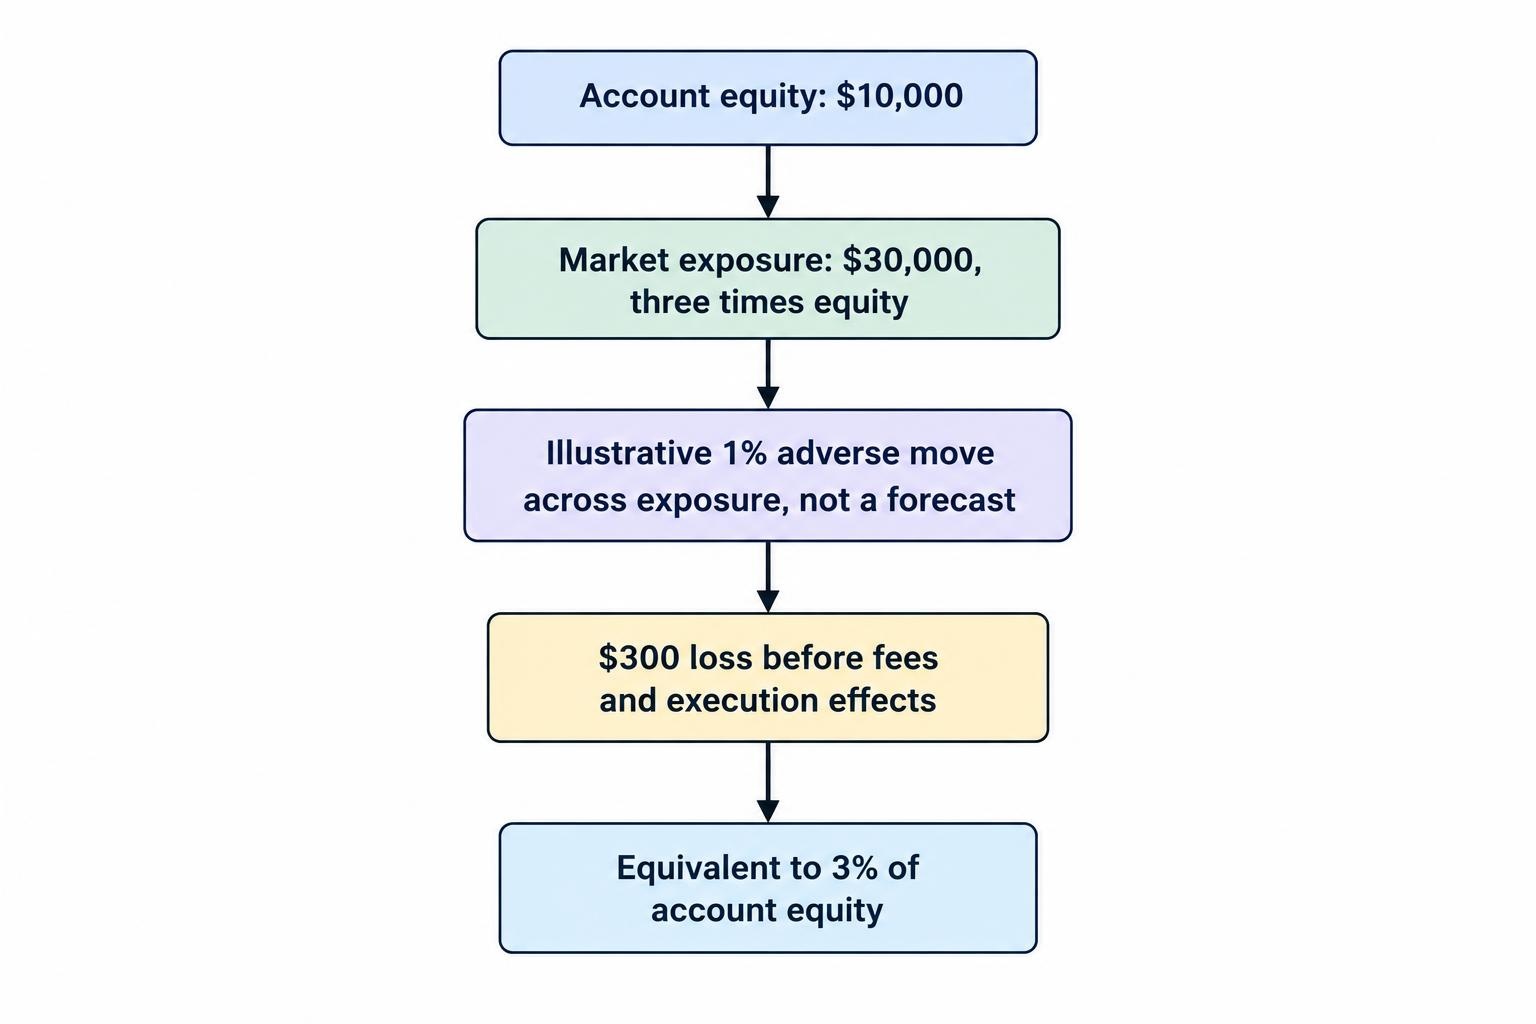
A simple example shows why position value matters. If an account has $10,000 and holds $30,000 of market exposure, gross exposure is three times account equity. A 1% adverse move across that exposure represents a $300 loss before fees and execution effects, or 3% of the account. A 5% adverse move would represent $1,500, or 15% of the account, assuming the exposure moved together and remained open throughout. This is an illustration, not a forecast: actual results depend on product design, price movement, financing, margin terms and execution.
Leverage does not improve a model’s forecast. It scales the financial consequences of acting on it. A signal with a small statistical edge can still produce unacceptable losses if the position is too large, the signal fails during a market change, or several trades lose at once. Before using a model output to set order size, separate its prediction from the account’s capacity to withstand a bad outcome. The article on AI trading risks and trader protection covers related issues such as misleading performance claims and system limits.
Gross exposure is a starting point, not a full risk measure
Gross exposure adds up the absolute values of positions, ignoring whether they are long or short. Net exposure offsets longs against shorts. Both figures are useful, but neither tells the whole story. A portfolio can have modest net exposure while holding large offsetting positions that may not hedge each other reliably. Gross exposure can also understate the risk of options or other nonlinear instruments if it is calculated only from the cash paid or margin deposited.
For a first pass, express each position’s notional value as a proportion of account equity, then total both gross and net exposure. Next, group positions by the market factors that can drive them: broad equity direction, interest rates, currency movements, commodity prices, sectors or volatility. The important question is whether supposedly separate positions rely on the same driver. Two bots trading different technology stocks may have different rules, but both can suffer when technology shares fall together.
| Measure | What it helps show | What it can miss |
|---|---|---|
| Gross exposure | Total absolute position value relative to account equity | Differences in volatility, instrument design and hedging effectiveness |
| Net exposure | Net long or short direction after offsetting positions | Large offsetting trades that can diverge or become costly to maintain |
| Margin usage | Capital currently committed under the broker’s margin rules | Losses beyond current margin, changing requirements or poor execution |
| Stress loss | Estimated account impact under a defined adverse scenario | Scenarios not included, including unexpected gaps or changing correlations |
For options, notional value alone can be misleading. A small premium may control a much larger underlying position, while the option’s sensitivity changes as price, time and volatility change. Delta-adjusted exposure can offer a more informative estimate of directional sensitivity, but it is still an estimate, not a guarantee of the loss limit. A portfolio with short options can face losses that grow quickly in a sharp move. Position sizing should reflect the instrument’s payoff and account terms, not just the cash initially paid.
Correlation can hide concentration across strategies
Correlation describes how returns have moved in relation to each other over a chosen period. A correlation near one indicates that two return series tended to move in the same direction over that sample; a value near zero indicates a weaker linear relationship, and a negative value indicates they tended to move in opposite directions. It is a historical statistic, not a promise about the next session. The result also depends on the data frequency, lookback window and return series used.
That distinction matters for AI portfolios. A trend model, a news sentiment model and a chart pattern model may appear to use different methods. If all three buy the same asset after positive market momentum, they may add exposure to one common risk rather than diversify it. The same can happen across different assets: several instruments may be sensitive to the same currency, sector or broad market move. Count the underlying exposure, not just the bots.
Correlation estimates can also shift. A pair of strategies that behaved differently in ordinary conditions may become more alike during a sharp selloff, a volatility spike or a liquidity shock. Federal Reserve research discusses how estimated relationships between assets can vary across market conditions; its work is a reminder to treat a past correlation reading as conditional evidence, not a permanent portfolio feature. A single low correlation number should not be used to justify larger positions.
For a portfolio of two positions, the combined risk depends on each position’s volatility and their correlation, not correlation alone. In plain terms, two volatile positions can still create substantial risk even if their returns have not moved closely together in the past. For a larger portfolio, interactions among all positions matter. A model’s displayed “diversification score” is only useful if its calculation, data and assumptions are clear enough to inspect.
Why AI systems can create hidden overlap
Automation can multiply exposure without making the overall account easier to see. Two systems may run on separate schedules, use different code or connect through different tools, yet submit orders to the same account. One may treat a position as a short-term trade while another treats it as a longer-term investment. If their orders overlap, the account carries the combined position until one system recognizes and reconciles it.
Model training can create another kind of overlap. Separate models may rely on similar inputs, such as recent returns, volatility, price momentum or news tone. Their forecasts can therefore respond to the same market information even when their names and architectures differ. An AI label does not make a strategy independent. Compare the actual trades and return series, then check what shared market factor could explain gains and losses.
Backtests may understate this problem if they assess each strategy separately. A strategy can look acceptable on its own while several strategies together exceed the intended portfolio risk. Testing should account for simultaneous positions, overlapping holding periods, fees and financing, and the sequence in which losses occur. The guides to comparing an AI strategy with relevant benchmarks and walk-forward testing address related evaluation issues.
Position duplication is an operational risk as well as a strategy risk. A delayed response, repeated webhook or lost confirmation may lead a system to submit an order twice or fail to register a fill. If another bot also acts on stale account data, the true net position can differ from the model’s view. Handling duplicate orders and connection failures is part of controlling that risk. A portfolio calculation built on stale or incomplete positions can give a false sense of safety.
Margin calls and forced liquidation can change the outcome
Margin requirements are not the same as a maximum-loss limit. In a securities margin account, the broker lends funds against account collateral, and the account holder remains responsible for meeting the terms. The SEC’s Investor Bulletin on margin accounts warns that losses can exceed the amount invested and that a firm may sell securities to meet a margin deficiency, potentially without first consulting the customer. Broker terms and product rules matter, so traders need to review the actual agreement and liquidation policy that apply to their account.
In U.S. retail over-the-counter forex, margin can create exposure substantially larger than the deposited amount. The CFTC’s customer advisory on OTC forex risks notes that customers may lose all of their margin and could be liable for additional losses. This is product- and jurisdiction-specific; do not assume rules for one market or account apply to another. Check the relevant regulator and contract documentation before trading.
A forced close can occur at a poor time. If several positions are losing together, available equity may shrink just as spreads widen or prices move quickly. A system may be unable to exit at its assumed price, and a stop order does not guarantee a particular execution price in a fast or gapping market. If the broker liquidates positions to meet its requirements, it may close trades in an order the trader did not choose. Treat margin headroom as a buffer to monitor, not as spare capital that is automatically safe to use.
Measure portfolio risk under shared adverse moves
A practical review starts with a current position inventory. Include every live order and holding across strategies, then record direction, notional value, instrument type, leverage or margin use, and the market driver each position depends on. Include pending orders where they could add exposure. Check that account equity, open positions and filled orders are current. If the systems cannot agree on the account’s true position, pause new risk until that discrepancy is resolved.
Next, test scenarios that can hurt several positions at once. Examples include a broad market decline, a jump in volatility, a sharp move in a currency that affects multiple holdings, or a change in interest rates that hits both equities and bonds. Use a range of shocks rather than one neat forecast. Include a case where normally distinct strategies move together, and a case where exits are delayed or executed at worse prices than expected. A stress test is a planning tool; it does not predict the maximum possible loss.
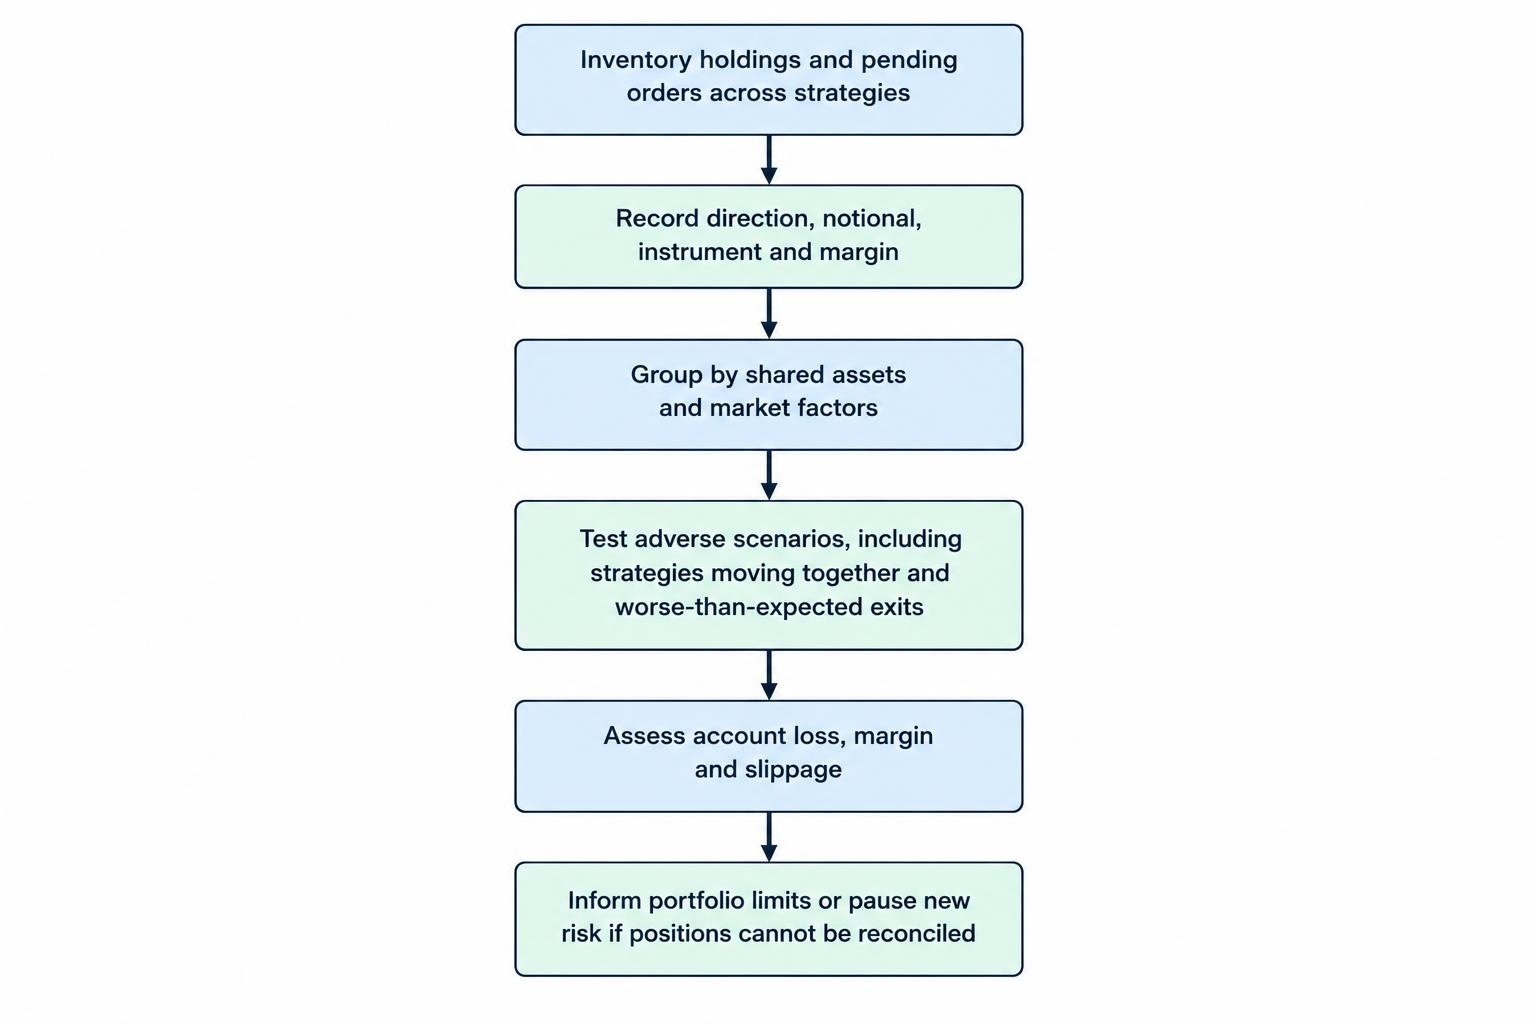
- Calculate gross and net exposure as a share of current account equity.
- Group positions by shared assets, sectors, currencies and market factors.
- Estimate the account impact of adverse price moves and higher volatility.
- Check available margin after losses, fees and potential slippage.
- Repeat the review with correlations closer to one for positions that may fail together.
Also examine the path of losses. Two portfolios may have the same final return in a backtest, but one may experience a much larger interim drawdown or several losing positions at the same time. Those differences affect whether the account can remain open long enough for a strategy to recover. Reviewing drawdown, exposure and performance under stressed conditions is more informative than relying on win rate or average return by itself.
Set portfolio limits before enabling automation
Limits should apply to the combined account, not only to each bot. A per-strategy position cap can still permit an excessive total when several strategies trade the same assets. Define limits for gross exposure, asset or sector concentration, margin usage and loss at the portfolio level. Set thresholds that trigger a pause or manual review before the account reaches a broker’s liquidation point. The exact values depend on the trader’s finances, instruments and risk tolerance; there is no universal safe leverage multiple.
Use controls that can stop new risk when data or system behavior becomes unreliable. Examples include blocking orders when positions cannot be reconciled, rejecting trades that breach a portfolio cap, and requiring human approval after unusual losses or a sharp change in model output. A risk limit that exists only in a dashboard is not a control. It needs to be enforced in the order path and tested against failed connections, repeated alerts and partial fills. See kill switches, trading limits and human oversight for related safeguards.
Review limits after changes to model inputs, position sizing, instrument mix or account terms. Retraining or a new model version can alter the timing and size of trades even when the strategy’s label stays the same. Monitor realized exposure and strategy overlap, not only the model’s intended allocation. If performance or trading behavior changes, investigate before allowing the system to scale back up; the guide to model drift and performance decay covers that monitoring problem.
A compact exposure review for traders
Before placing or automating a trade, ask what happens to the portfolio if this position moves against you at the same time as the others. Check whether the position adds a new source of risk or repeats one already present. Estimate the loss as a share of account equity under more than one adverse scenario, and leave room for fees, financing and imperfect execution. If an answer depends on a low historical correlation, treat that assumption as uncertain and reduce the exposure or test a harsher case.
Leverage is easiest to underestimate when each trade appears small and each bot appears independent. A shared account can tell a different story. Track combined exposure, stress-test correlated losses, and make sure automated limits work when data or execution fails. If the portfolio cannot be explained in terms of what drives its gains and losses, it is not ready for more leverage.