Paper trading runs an AI trading system against live or near live market data without placing real money at risk. It can show whether the system receives data, produces signals and follows its rules in changing market conditions. It cannot, by itself, prove that the strategy will make money in a funded account. Simulated orders do not face every constraint of real execution, and the results depend on how the platform models fills, costs and delays.
That makes paper trading a useful test between historical research and live trading, not a certificate of profitability. It can expose software faults and unrealistic assumptions before they cost money. Its strongest evidence is operational: the system did what it was designed to do, at the time it was supposed to do it, using information available then. Its weakest evidence is a short run of attractive simulated returns.
What paper trading can test
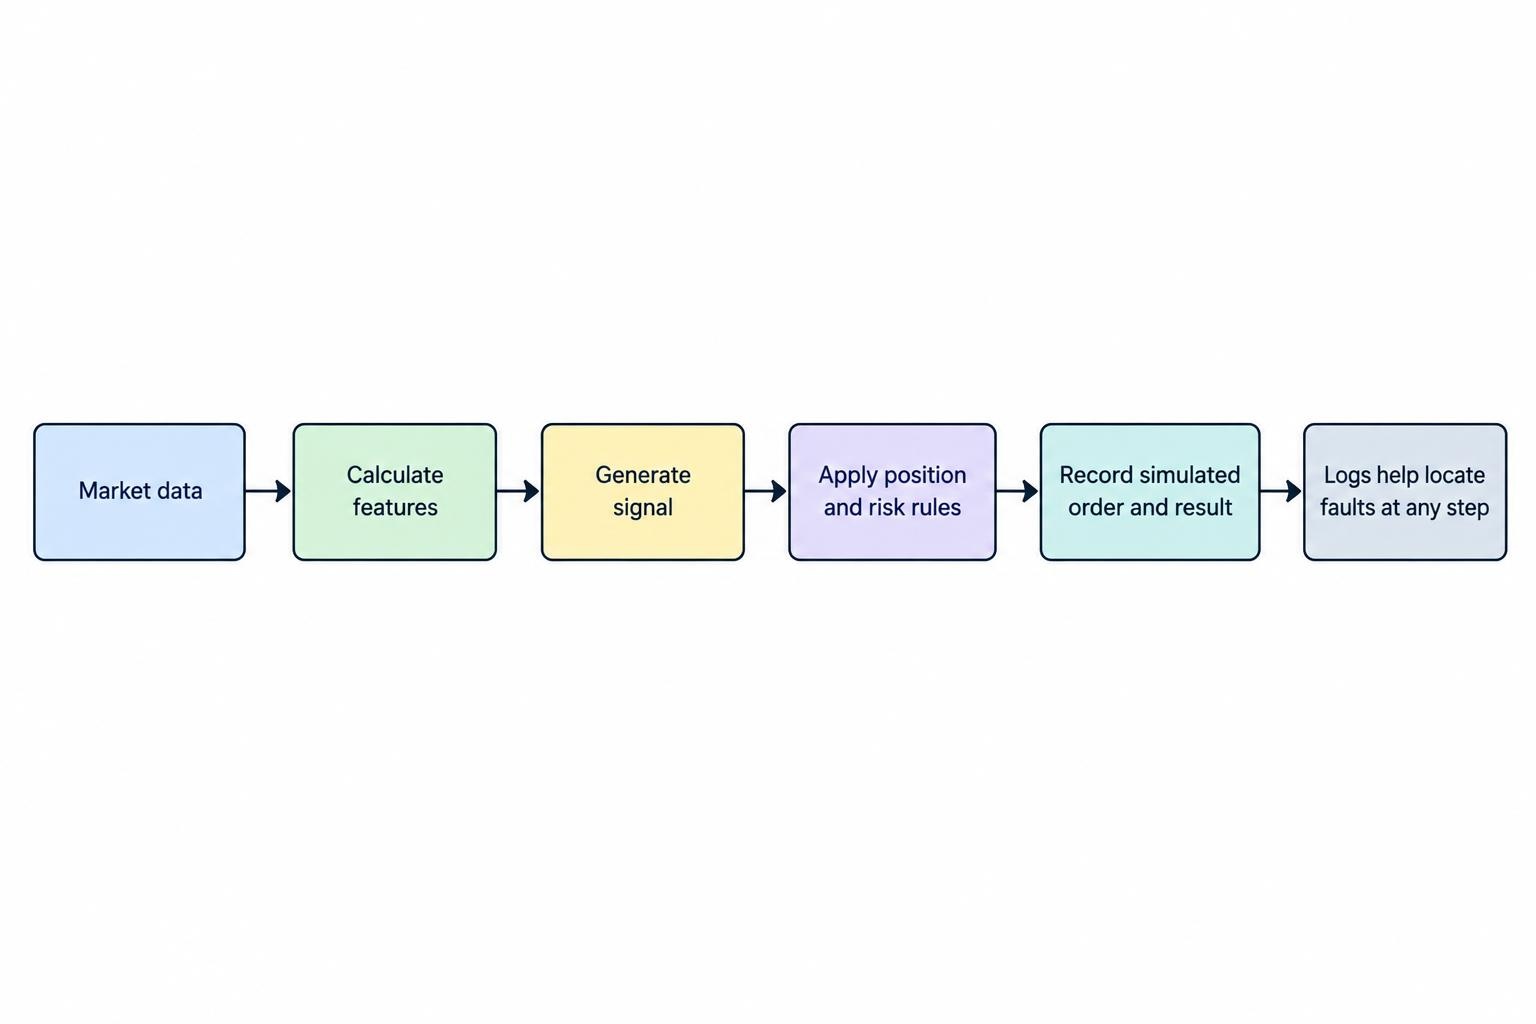
A well designed paper test checks whether an AI system works as a complete process, rather than whether a model can produce an impressive forecast in isolation. The system should receive market data, calculate its features, generate a signal, apply position and risk rules, and record the simulated order and result. If any step breaks, the log should make it possible to find out where. That is useful even if the strategy loses money: a test that reliably shows the strategy is not working has saved the trader from treating a software demo as proof.
Paper trading can also reveal issues that a historical replay may miss. A feed may arrive late, a data field may be missing, a market may be closed, or the model may respond differently than expected to a live prompt. The system might send duplicate orders after a reconnect or calculate a signal from stale prices. These are testable behaviors. They matter especially when an AI model, data service or other external component can change independently of the trading rules.
The test also gives a record of decisions made in real time. That record can show whether signals were generated consistently and whether the rules were followed through a losing streak, a news event or a change in volatility. But a record of simulated decisions is not the same as evidence that those decisions could have been filled at the prices shown.
What simulated results cannot establish
A simulated account does not put capital at risk. It therefore cannot show how a trader will react to real losses, whether they will keep the system running during a drawdown, or whether they can meet margin requirements. Nor does it guarantee that a real order would fill at the simulation’s price. A simulated stop may appear to execute neatly even when a real market moves through the trigger, the spread widens or available liquidity is thin.
The CFTC warns that hypothetical results may omit factors such as spreads, execution uncertainty and market impact, and may overstate or understate a system’s performance. Its warning concerns commodity trading systems, but the execution gap is worth considering in other markets too: a paper platform’s assumptions determine what its results mean. Read the platform’s fill rules before treating its performance report as evidence. CFTC advisory on hypothetical commodity trading results
Paper trading also cannot establish that a model will keep working after the test period. Markets change. A signal that happened to work during a stretch of rising prices may fail in a choppy or falling market. A model that has been repeatedly adjusted in response to the same test results has not received a clean forward evaluation. It has received more opportunities to fit the past.
Backtesting, paper trading and live trading
These stages answer different questions. A backtest applies rules to historical data and estimates how they might have performed. Paper trading applies a system prospectively to current data, but uses simulated execution. Live trading sends orders to the market and introduces real fills, costs and financial risk. Moving through the stages adds evidence, but each one still has limits.
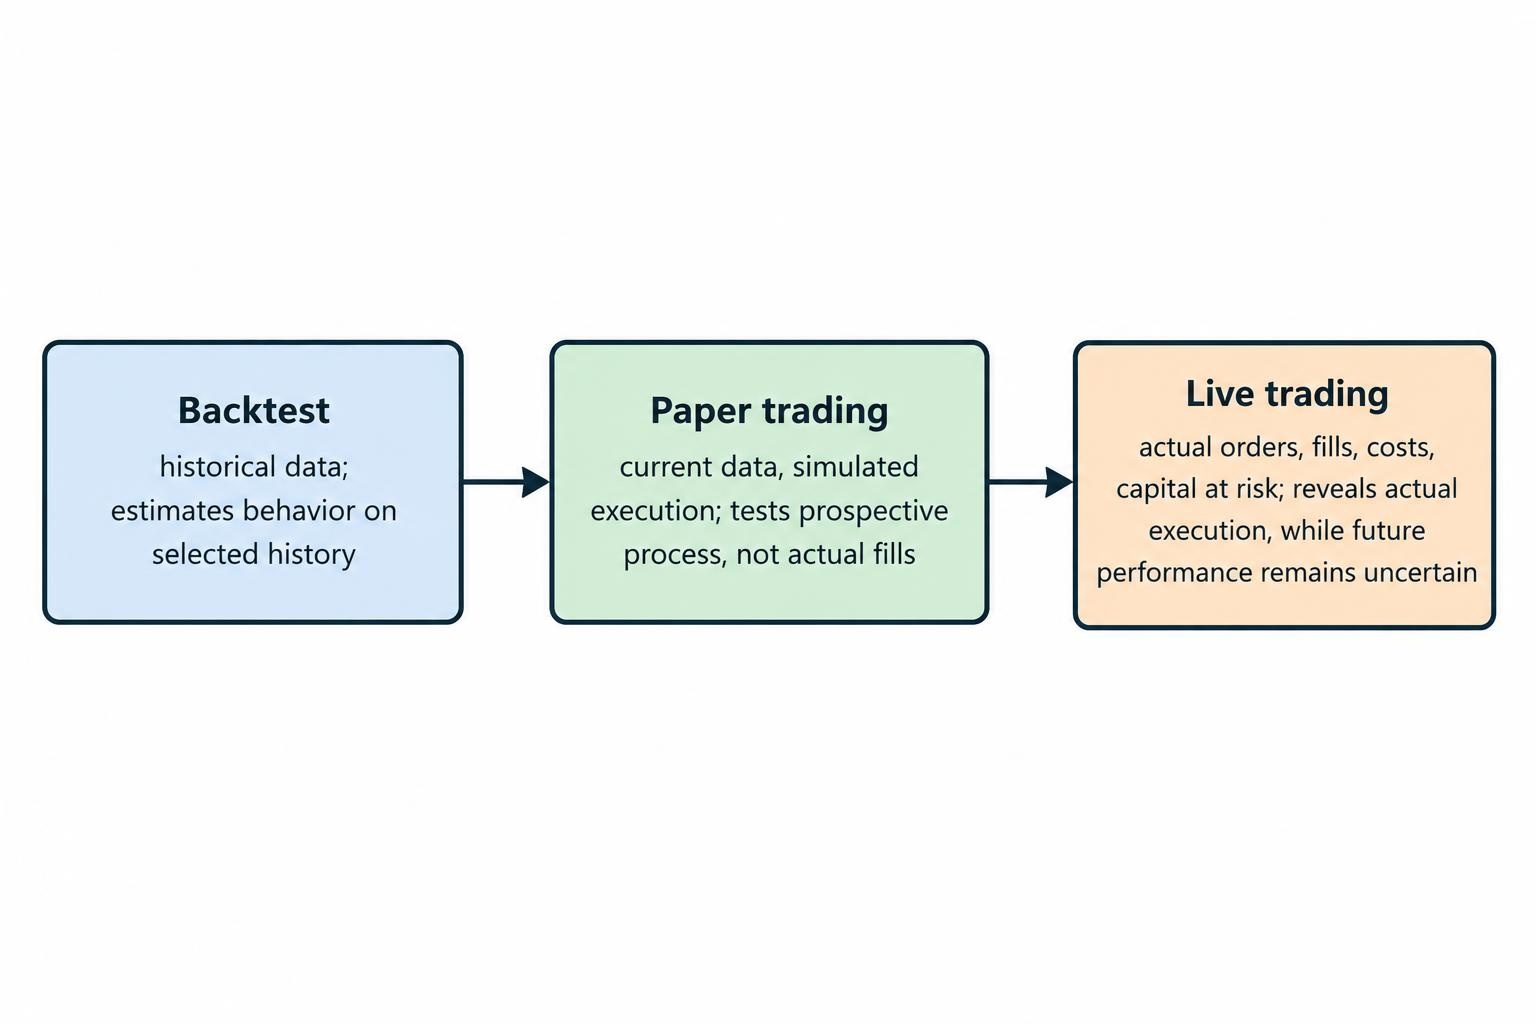
| Test stage | What it can help assess | What it leaves uncertain |
|---|---|---|
| Historical backtest | How defined rules behave on the selected historical data | Whether the result generalises, or whether historical prices and execution assumptions are realistic |
| Paper trading | Whether the system handles current data and follows its process prospectively | Whether real orders would fill the same way, and whether results will persist |
| Live trading | How the system behaves with actual orders, fills, costs and capital at risk | Whether performance will continue under different market conditions |
A paper test is more informative when it follows a defined historical research process rather than replacing it. Review how to prepare historical market data before interpreting a backtest, then keep training, validation and test periods separate using a plan such as the one in time series data splitting. A forward paper period should not become another tuning set. If the trader changes the model after seeing each disappointing result, the reported performance no longer reflects a fixed test.
Design a meaningful paper test
Write down the test plan before it starts. Specify the instruments, trading hours, signal rules, position limits, data sources, simulated order types and the dates covered. Record what counts as a completed trade and how the strategy handles missing data, market closures and rejected orders. If the AI component can change, record its model or service version, prompt or configuration, and any changes made during the test. Without this record, it can be hard to tell whether a performance change came from the strategy, the data or a model update.
Keep the paper system as close as practical to the intended live process. Use the same data timing, signal schedule, risk checks and order logic. If a live system would wait for a completed bar before acting, the paper system should not use information from a bar that was still forming. If the system uses an AI assistant to interpret text or classify conditions, save the input and output, along with the timestamp. That makes an unexpected signal easier to investigate later.
Set execution assumptions conservatively. Track the quote available when the signal was generated, the simulated order price, the time to simulated fill and any assumed fees or slippage. A market order filled instantly at the last traded price can make an illiquid strategy look much better than it is. Estimate trading costs separately and compare the paper platform’s results with those assumptions; the guide to including costs in trading tests covers the details.
Decide in advance what the test is meant to establish. If the question is whether the system can run reliably, track technical faults, missed signals, duplicate actions and rule violations. If the question is whether a strategy has promise, track returns after estimated costs alongside drawdown, turnover, exposure and the number of trades. Performance metrics beyond win rate help prevent one easy headline number from carrying the whole argument. A high win rate can still hide large losses or poor average trade results.
How much paper trading is enough?
There is no universal number of days or trades that turns simulation into proof. The useful amount depends on how often the strategy trades, what conditions it is meant to handle, and how much uncertainty remains in the execution model. A day trading system may generate many observations quickly, but they may all come from one narrow market condition. A slower strategy can take longer to produce enough trades for a meaningful review.
Judge the test by its coverage, not just its duration. Has it included the market hours, volatility levels and signal types the strategy is designed for? Were there enough trades to examine the distribution of gains and losses, rather than just the total return? Did the strategy encounter losing periods and still follow its rules? These questions do not erase sampling uncertainty, but they are more useful than declaring success after an arbitrary stretch of green results.
Keep the rules frozen during the evaluation period where possible. When a change is necessary to fix a bug or address a risk, document it, assign a new version and treat later results as a new test segment. Repeatedly adjusting a system after viewing its results can create overfitting or data leakage, even if no historical prices were used directly.
Review the results against a fair comparison
Review every simulated order, not just the final account balance. Compare the signal time with the data timestamp, then inspect the simulated entry and exit, the assumed fill, and the reason the system opened or closed the position. Check losing trades and missed trades too. If the platform does not preserve an audit trail, its summary figures may not be enough to diagnose what happened.
Compare the strategy with a simple baseline that uses the same instrument, dates and cost assumptions. A model that appears profitable may still add little value if a basic rule performs similarly with fewer moving parts. A benchmark can also show whether the result came from the model’s signals or from broad market exposure. Use relevant benchmarks for an AI strategy rather than comparing unrelated periods or instruments.
When possible, use a walk forward approach: develop the rules on earlier data, then assess them on later data that was not used for tuning. A prospective paper period can extend that discipline by testing decisions as new data arrives. It does not fix poor historical research, but it can expose whether a result survives outside the period that shaped the model. See walk forward testing and out of sample evaluation for a fuller testing plan.
When to consider a move beyond simulation
Consider moving to the next stage only when the system’s data flow, order logic and risk controls have behaved as expected, and the results have been assessed against costs and a fair baseline. This is a readiness check, not a prediction that the strategy will be profitable. Start with strict exposure limits, verify every live order and keep the ability to stop trading without relying on the model itself. A small live test can reveal execution differences that a paper account could not, but it also puts money at risk.
Set conditions for pausing before the first live order: an unexpected position, a data feed failure, a series of rejected orders, or performance outside pre-set risk limits. Do not treat a paper account’s best run as a sensible live position size. The practical purpose of simulation is to find problems while the cost of finding them is low. It can show that an AI trading system runs as specified under observed conditions. It cannot promise the next trade, or the next market regime, will cooperate.