An AI trading strategy should be compared with a clear alternative, not judged by whether its backtest looks profitable on its own. A model might beat a buy and hold portfolio simply because the market rose during the test. It might also beat a basic rule only because it took more risk, traded a different asset mix, or benefited from assumptions that would be hard to reproduce live. The comparison needs to answer a practical question: does the AI method add value over a simpler approach that could reasonably be used instead?
That means defining the strategy and its benchmark before reviewing results. Choose comparable data, dates, assets, position sizing and trading costs. Then compare performance on data the model did not use to learn or tune its rules. A strong result is evidence worth investigating, not proof that the strategy will keep working. A weak result is useful too: if a simple rule performs just as well, the added model complexity may not earn its keep.
What a fair comparison should establish
A benchmark is a reference strategy or portfolio used to judge another approach. For an AI trading system, that reference could be a passive investment, a simple trading rule, or a second strategy designed for the same market and objective. The right choice depends on what the AI system is meant to do. A short term signal that trades one index should not be judged only against a diversified long term portfolio; the two take different risks and answer different questions.
Start by writing down the intended use. Is the model meant to forecast market direction, filter entries, adjust position sizes, or manage a portfolio? Then select a benchmark that performs a similar job. If the model filters trend following entries, compare it with the same trend rule without the AI filter. If it ranks stocks, compare it with a transparent ranking rule or a suitable index, depending on whether the question is about stock selection or portfolio results. The comparison should isolate the part of the process the model is supposed to improve.
Before selecting benchmarks, set aside data that will not be used to build the system. Keep the time order intact: financial observations are not interchangeable samples, because a model trained on later market conditions must not influence a test of earlier decisions. A disciplined time series data split helps separate model development from evaluation. If the same period is used repeatedly to choose features, tune settings and report the winner, it is no longer a clean test.
Choose benchmarks that answer different questions
Most comparisons benefit from more than one benchmark, but each one should have a stated purpose. A passive benchmark shows what an investor might have earned by holding an appropriate market exposure. A simple rules based benchmark tests whether the AI adds anything over a transparent decision process. A cash or risk free reference can help put returns in context when the strategy holds little exposure. These references are not interchangeable, and reporting several does not mean picking whichever makes the model look best.
| Benchmark | What it tests | Where it can mislead |
|---|---|---|
| Passive, market matched portfolio | Whether active decisions added value over holding relevant market exposure | May have different risk, exposure or diversification from the strategy |
| Simple rule with the same inputs | Whether the AI adds value beyond a transparent baseline | Can be unfair if the rule is deliberately weak or poorly tuned |
| Cash or low exposure reference | Whether taking market risk produced a worthwhile result | Does not represent a comparable investment strategy |
| Existing strategy without the AI component | Whether the model’s intended contribution improves the underlying method | Requires the rest of the process to remain consistent |
For a stock selection model, a broad market index may be a useful reference, but it does not settle every question. The model may hold a narrow group of companies, trade frequently, or carry a strong tilt toward a particular sector. A sector or style benchmark can help expose that difference. For a futures strategy, a passive buy and hold position may be impractical or unlike the strategy’s mandate; a benchmark with comparable exposure and risk may be more informative. Explain why each reference was chosen, and what it cannot show.
The SEC’s investor bulletin on performance claims notes that backtests are hypothetical, that market conditions and fees matter, and that benchmark selection should compare similar markets and investment types. That is a useful standard for reading a model report: ask what the benchmark represents, whether costs are treated consistently, and whether the displayed period includes both favorable and unfavorable conditions. A benchmark should clarify the result, not decorate it.
Build a simple baseline that is genuinely useful
A simple baseline is not a straw man. It should be credible, understandable and suited to the same task. If an AI model uses recent prices and trading volume to identify trends, a moving average rule or a momentum ranking may be a fair comparison. If it uses text to score market news, compare it with a no news version of the strategy or a basic, predefined news filter. If a model changes portfolio weights, test a static allocation or a simple volatility based sizing rule alongside it.
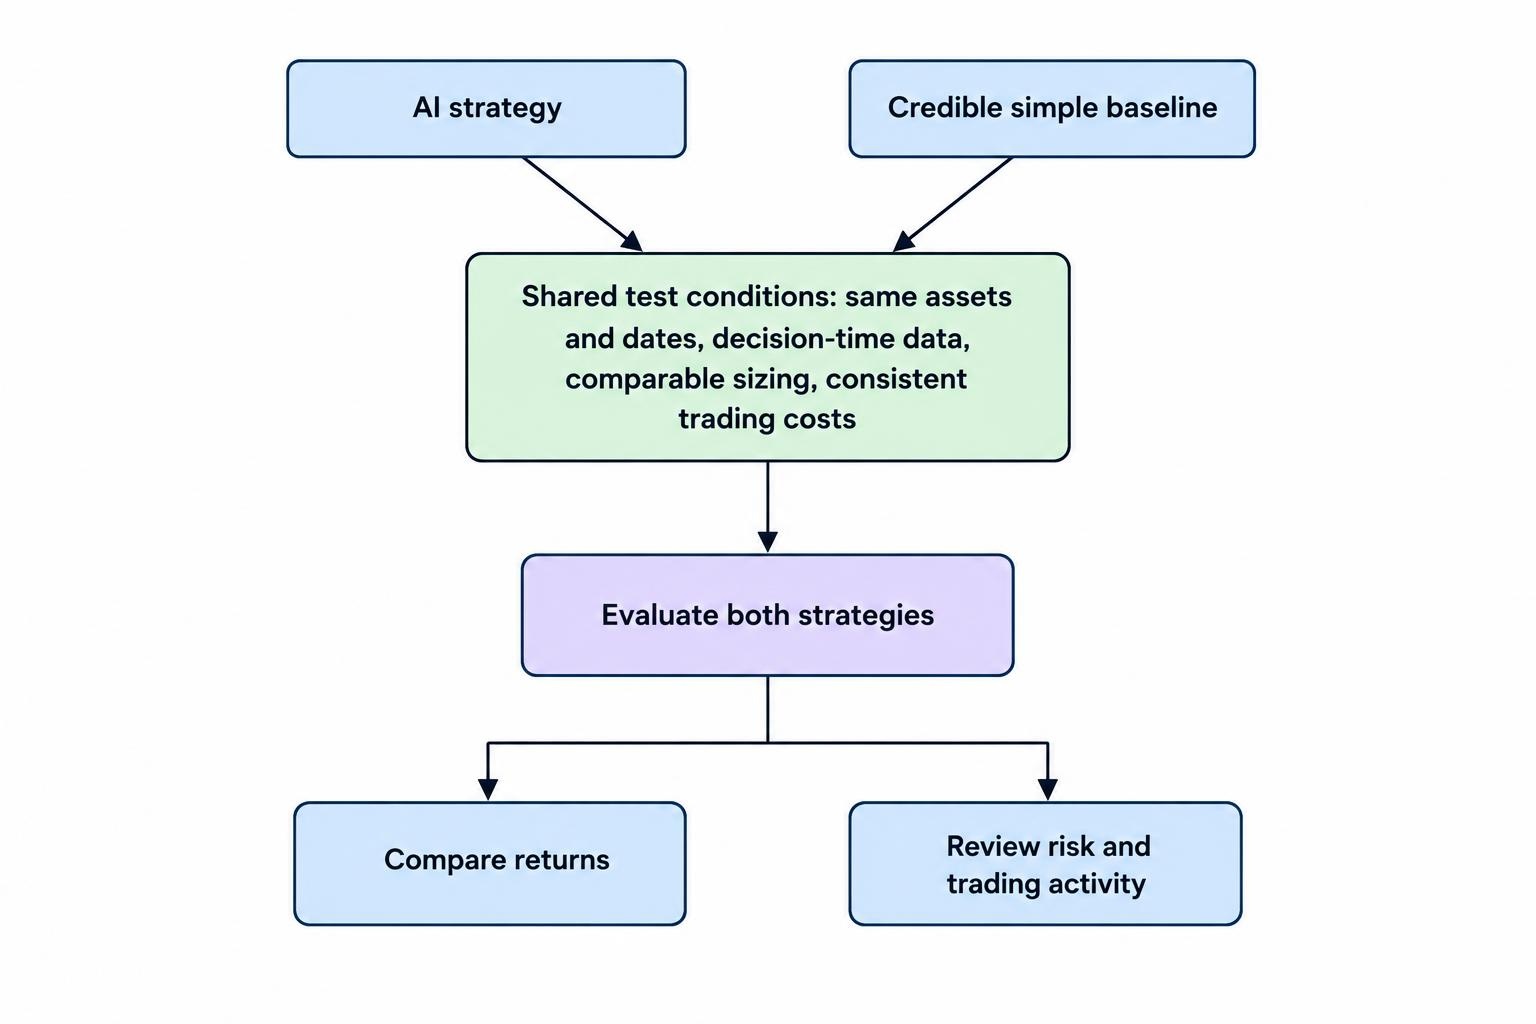
Keep the comparison as controlled as possible. Use the same assets, date range, data availability, trading hours, entry and exit timing, position limits and capital assumptions. Where the AI’s design requires different inputs, report that difference rather than pretending the systems are identical. For example, a model that receives company fundamentals should not be compared with a price only rule without acknowledging the extra information. The practical question is whether that extra information and complexity produce a measurable improvement after costs.
Document the simple rule before examining the final test results. If it is tuned after seeing how it performed on the test period, it has also been optimized against that period. A baseline can be tuned on development data, but it should then be frozen before final evaluation. The same rule applies to the AI system. Otherwise the comparison quietly turns into a contest between two methods that have both been coached by the answer key.
Keep the evaluation period separate
AI systems can test many features, model types and settings. Each change is another opportunity to find a version that happens to fit historical noise. A model with a striking in sample result may simply be the luckiest of many attempts. The more choices made after looking at the same data, the less convincing that data becomes as evidence of future performance. This is why a clean holdout period should be treated as a one time evaluation, not a workshop for further tuning.
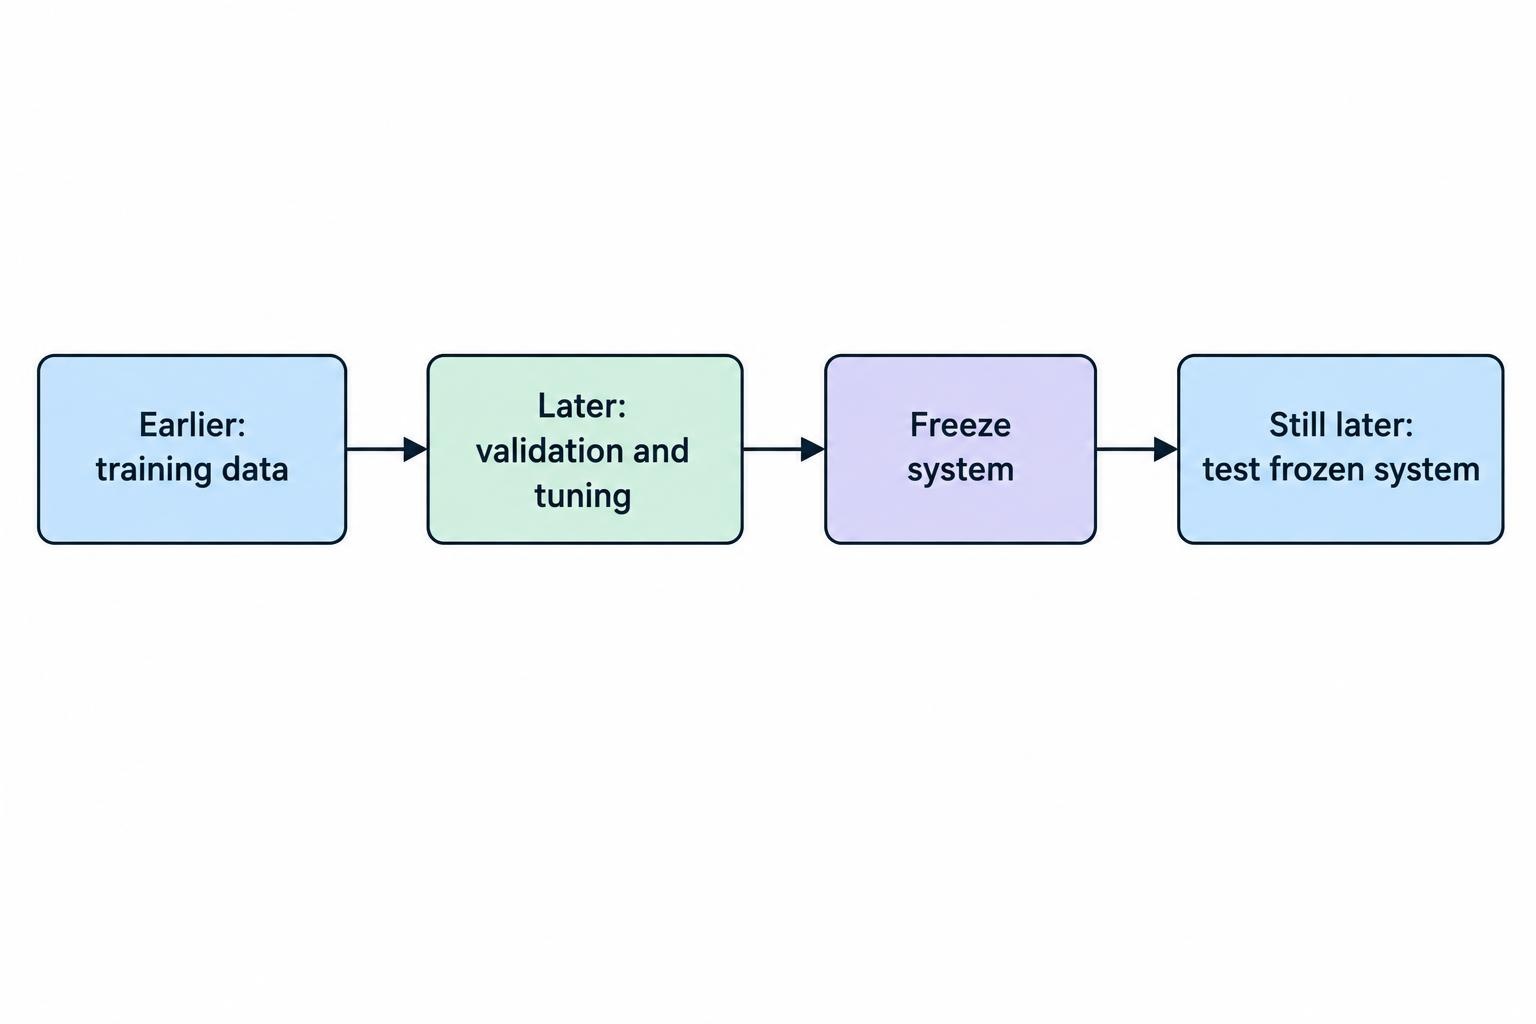
Use sequential testing where possible. Train on an earlier period, tune settings on a later validation period, then evaluate the frozen system on a still later test period. For greater coverage, a walk forward process repeats this pattern across several historical windows: each evaluation uses information that would have been available at that point in time. The method does not remove every source of bias, but it makes the timing of decisions easier to inspect. Read more about walk forward testing and out of sample evaluation before treating a single holdout result as decisive.
Market periods should also be described rather than lumped together. A strategy may perform well in a rising market and poorly during a sharp decline, or do the reverse. Review returns across different conditions, including quiet and volatile stretches where the available data permits. Avoid claiming the model is “regime robust” from a handful of selected dates. If the strategy only has a short record in a certain market condition, say so. The goal is to learn where performance came from, not to give every period a flattering label.
Compare return alongside risk and trading activity
Total return by itself is too thin a measure. Two strategies can finish with similar gains while one suffers larger drawdowns, holds risk for longer, or depends on a small number of outsized trades. Compare annualized return where appropriate, maximum drawdown, volatility, exposure, turnover and the number of trades. A risk adjusted measure such as the Sharpe ratio can add context, but it should not replace the underlying figures or be treated as a promise about future results.
Look at the shape of the returns. Did the result depend on a handful of unusually profitable positions? Were losses concentrated in a short period? Did the model sit in cash for long stretches while the benchmark remained invested? Did it make many small gains that could disappear once trading costs are included? These details help distinguish a repeatable process from a headline number that happens to look tidy in a chart. For a fuller view, see how to measure trading performance beyond win rate.
Keep the test consistent about dividends, funding, financing and fees. Include commissions, bid ask spreads, slippage and any other costs that apply to the strategy’s market and trading frequency. A high turnover model may look attractive before costs and disappointing after them. Estimate costs conservatively, and show the assumption used; false precision does not make a backtest more accurate. The CFTC warns that hypothetical trading results may fail to account for spreads, fees and execution effects, among other limitations. Its guidance concerns commodity trading systems, but those mechanics are relevant when assessing simulated trading in other markets as well.
Use a practical comparison sequence
A short, repeatable process makes it harder to change the rules after seeing an appealing result. First, state the AI system’s purpose and the decision it changes. Second, define a passive reference and at least one credible simple rule, each chosen to answer a clear question. Third, align the data, dates, assets, sizing and cost assumptions. Fourth, freeze the models and evaluate them on periods excluded from development. Finally, review returns, risk, costs and consistency across periods rather than ranking the methods by one number.
- Write the hypothesis. Specify what the model should improve, such as fewer false entries or better risk adjusted returns.
- Choose the references. Include a relevant passive benchmark and a transparent rule that performs a similar task.
- Set the test rules. Define data timing, costs, capital, position sizing and the evaluation period before reviewing final results.
- Report every method consistently. Present the same return and risk measures, with fees and exposure clearly stated.
- Record unsuccessful trials. Keep a log of model and rule variations so the winning backtest is not mistaken for the only version attempted.
That last step matters. If dozens of configurations were tested and only the best result is shown, the headline hides the search process. A weak baseline can make the AI appear more valuable than it is; a fair baseline is a real alternative, not a prop. Documenting trials also helps identify whether small design changes repeatedly reverse the result. If they do, the apparent edge may be fragile.
Read the result without overstating it
If the AI strategy beats both a suitable passive reference and a credible simple rule after costs on untouched data, that is a positive research result. It supports further testing, not a conclusion that future returns will match the backtest. If it only beats one benchmark, explain why. If it loses to the simple rule, that is a clear reason to reconsider the added complexity. A more sophisticated model is not automatically a better trading system.
Be cautious with comparisons that show only cumulative return, omit the benchmark’s exposure or use different fee assumptions. Ask whether the result is live or hypothetical, how much tuning was done, what dates were selected, and whether the data could have been known at the time of each trade. The SEC’s guidance on backtested and benchmark performance claims emphasizes that simulated results are not actual performance and that cherry picked periods can distort the picture. The CFTC likewise advises skepticism toward trading system claims that promise high profits with minimal risk, and highlights the gap between simulated fills and actual execution.
When reviewing a marketed AI system, request the exact benchmark, full evaluation dates, cost assumptions, and performance records beyond the best period. The CFTC advisory on commodity trading system claims specifically recommends checking whether results are hypothetical and whether claimed performance can be independently verified. That does not mean every favorable backtest is misleading. It means the evidence should be inspectable before the result is treated as meaningful.
What the comparison can and cannot tell you
A careful benchmark study can show whether the AI method improved on a stated alternative under defined historical conditions. It can reveal whether gains came from market exposure, extra risk, frequent trading, or the model’s actual decision process. It can also expose a simpler method that achieves similar results with fewer moving parts. Those are practical findings, even if the model does not “win.”
It cannot establish that the same advantage will persist. Markets change, execution differs from simulation, and results can be sensitive to design choices that looked harmless during development. Treat benchmark comparisons as one part of testing and validating an AI trading system, alongside realistic cost estimates, out of sample checks and careful monitoring. The standard is not a chart that looks impressive. It is a transparent comparison that gives a reader enough detail to judge what was tested and what remains unknown.