A trading strategy can look profitable in a backtest and still lose money once its trades meet real market prices. The gap often comes from costs the simulation ignored or understated: commissions, bid–ask spreads, slippage, market impact and financing. For a strategy that trades often, small costs can consume a large share of its expected return.
A useful backtest models the full trade, not just the signal. It should estimate what the strategy could have paid to enter, what it could have received on exit, and any charges for holding the position. The estimates will rarely match every live fill exactly. The aim is to make assumptions visible, plausible and strict enough to show whether a strategy still has room to work.
What trading costs belong in a backtest?
Trading costs include both direct charges and the difference between a theoretical price and an achievable execution price. Which costs apply depends on the instrument, venue, broker, order type and holding period. A share trade may involve a commission and spread; a futures trade may include exchange and clearing fees; a leveraged position held overnight may also incur financing or a swap charge. Taxes can apply in some markets, too.
| Cost | What it represents | Typical backtest treatment |
|---|---|---|
| Commission and fees | Broker, exchange, regulatory, clearing or settlement charges. | Apply the relevant charge to each order or transaction, using the account’s pricing schedule where available. |
| Bid–ask spread | The gap between the price available to buy and the price available to sell. | Buy at the ask and sell at the bid, or apply an equivalent spread cost without counting it twice. |
| Slippage | The difference between the assumed order price and the fill price the strategy might receive. | Model a shortfall against the intended price, with assumptions that vary where market conditions warrant it. |
| Market impact | The price movement caused by the order itself, especially when it is large relative to available liquidity. | Estimate from order size and liquidity, or test a range of impact assumptions. |
| Financing and borrow | Charges for holding leveraged positions or borrowing securities to sell short. | Accrue the applicable rate over the time the position remains open. |
| Taxes and other charges | Transaction taxes or instrument-specific charges that apply in the relevant market. | Include them when they apply to the account, security and jurisdiction being tested. |
The spread is not an abstract penalty added by a simulator. It reflects the difference between buy and sell prices. The SEC’s explanation of the bid, ask and spread describes the basic relationship: buyers generally pay the ask, while sellers receive the bid. If a backtest enters and exits every position at the same mid-price, it gives the strategy a price that may not have been available on either side of the trade.
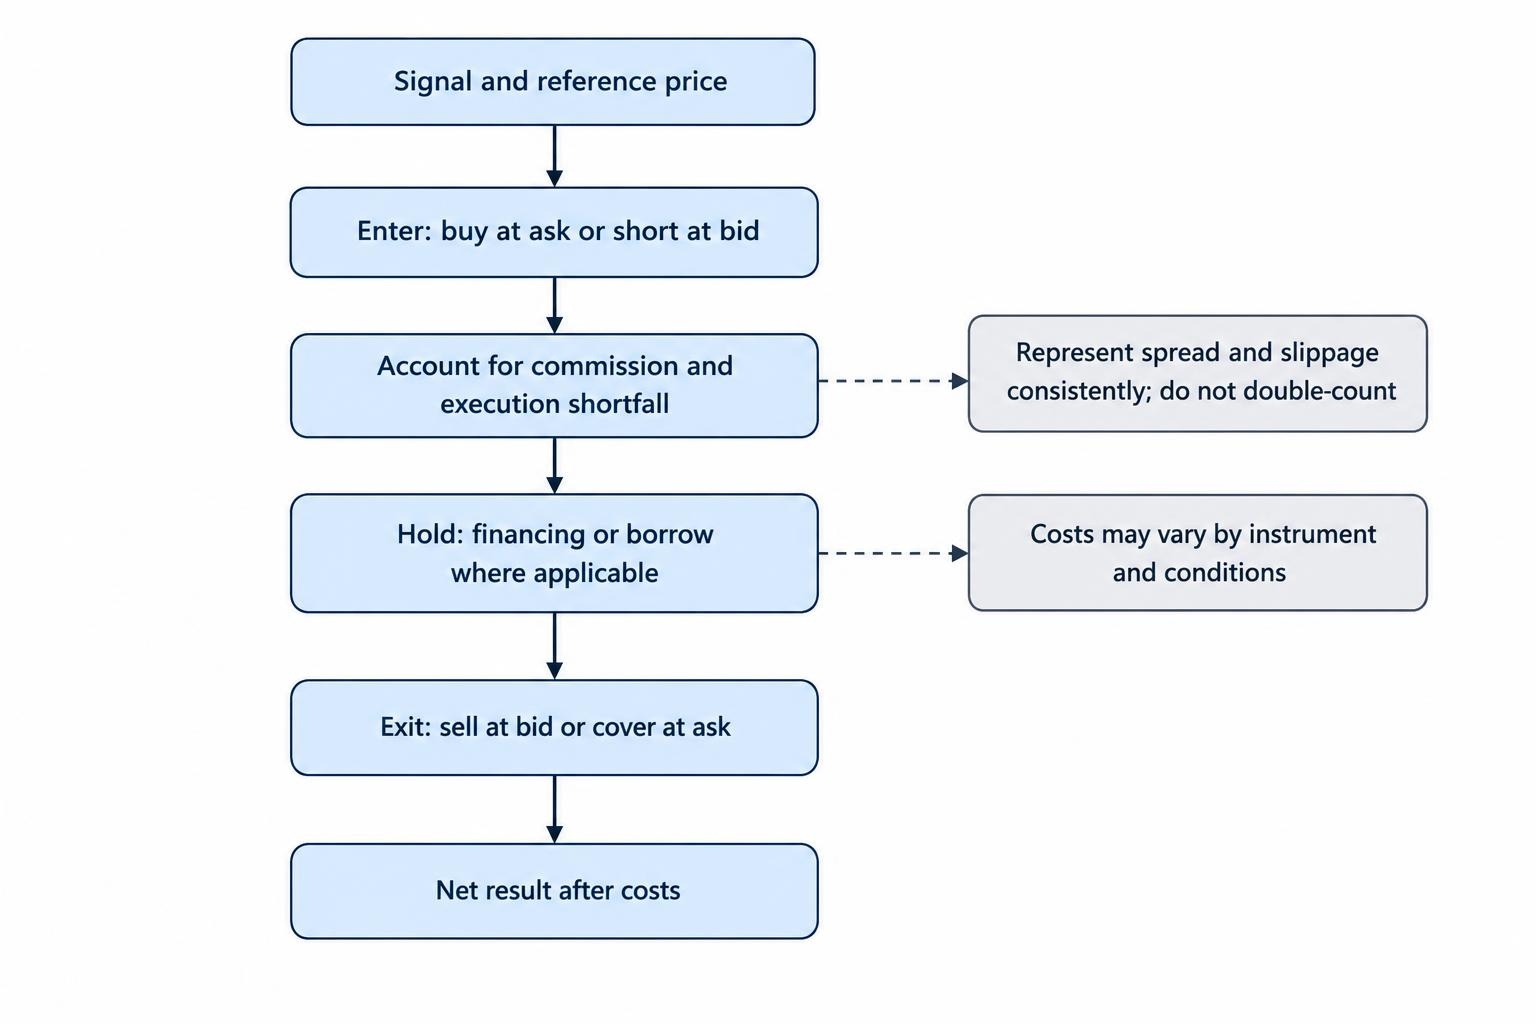
Data and execution assumptions need to fit together. A simulation with daily closing prices cannot reliably reproduce an intraday fill just by subtracting a flat fee. The closing price may not represent the price available when the signal was generated, and daily bars do not reveal how prices moved within the bar. Review the data requirements in historical market data preparation before deciding what execution detail the test can support.
Model commissions and fees per order
Commission schedules differ. A broker may charge a fixed amount per order, a fee per share or contract, a percentage of trade value, or a combination of charges. Some costs apply to both entry and exit. A backtest should reflect the schedule relevant to the intended account, not an attractive rate chosen because it improves the results.
For a percentage fee, a simple calculation is:
Fee = traded value × fee rate
If the backtest trades $10,000 and the fee is 0.05% per side, the estimated fee is $5 for that transaction. If the strategy later closes the full position, apply the exit fee as well. For a per-share or per-contract charge, calculate the fee from the quantity traded, and check for minimum charges that can matter on small orders.
Count actual turnover. A signal that changes a portfolio from 100% long to 100% cash generates an exit order even if it does not open a short position. Rebalancing can also create trades when the target weight changes but the asset remains in the portfolio. Applying costs only when a signal flips from buy to sell can miss these adjustments.
Be clear about what “one-way” means in a cost assumption. A stated fee of 0.05% per side means 0.05% to enter and 0.05% to exit, for a 0.10% round trip before spread, slippage and other costs. A quoted round-trip estimate already covers both directions. Mixing the two conventions can make a test look far cheaper—or more expensive—than intended.
Represent the spread without double counting
When historical bid and ask data are available and reliable, use the relevant side of the quote to model execution. A market buy generally executes against offers; a market sell generally executes against bids. For a long position, that means the entry price can be based on the ask and the exit price on the bid. A short trade reverses the sides: it sells at the bid to enter and buys at the ask to cover.
When the backtest uses mid-prices, the spread can instead be represented as a cost around that reference price. If the quoted spread is 10 cents, a simplified model might charge about 5 cents per share when entering and 5 cents when exiting, assuming the mid-price is the reference at each trade. This is an approximation, not a universal fill rule. The result depends on whether the strategy uses market orders, passive limit orders or a mix.
Never apply both executable bid or ask prices and a full spread deduction to the same fill. That counts the spread twice. Write down the price convention in the test: mid-price, last trade, bid, ask, or another reference. Then check every cost adjustment against it.
Spreads change with the instrument and market conditions. A fixed spread may be a reasonable first pass for a liquid asset during ordinary trading hours, but it can understate costs when liquidity is thin or volatility rises. A study of intraday stock strategies found that floating spread assumptions affected backtest performance differently from fixed spread assumptions, underscoring why one constant value may not capture trading conditions across time. For daily data without historical quotes, treat the spread as an estimate and test several plausible levels rather than presenting one value as exact.
Estimate slippage and market impact
Slippage is the difference between the price assumed by the strategy and the price it could plausibly receive. It can occur because prices move between the signal and order, because the order cannot be filled at one price, or because execution takes time. Market impact is the part of execution cost caused by the order changing the available market price. The terms are related in practice, but a model should define what each component includes so the same shortfall is not charged twice.
A useful starting point is to compare the assumed order price with the next price that could reasonably be traded, not automatically with the price that generated the signal. If a strategy observes a closing price and then enters at that same close, it may be using a price that was already known only after the relevant trading period ended. A next-bar or next-session execution assumption can be more defensible, although it still does not capture every intraday move.
For market impact, order size matters relative to liquidity. A 500-share order may be modest in a heavily traded stock and material in a thinly traded one. A simple model can apply a larger cost when the order represents a larger fraction of recent volume. More detailed execution data may support better estimates, but daily volume alone cannot show how much liquidity was available at the intended moment or at the quoted price.
Keep slippage assumptions connected to the strategy. A fast strategy that sends many orders may face different execution conditions from a system that trades only a few times a month. A limit-order strategy also needs a fill model: assuming that every touched limit price fills immediately can overstate performance. The order may not have been filled, may have filled only partly, or may have received priority behind other orders.
When execution data is unavailable, run a range of slippage assumptions and report the results at each level. A single “conservative” figure can create false confidence if nobody can explain how it was chosen. A range shows how much the strategy depends on an uncertain input.
Include financing and holding costs
Some trades incur costs while they remain open. Depending on the product and account, these may include financing on leveraged exposure, swap charges in certain foreign-exchange or contract-for-difference products, and borrow fees on short positions. These rates can vary over time. A fixed annual rate applied to every instrument may be too crude, especially if positions are held for different lengths of time or cross a financing date.
For a simple annual rate, an approximate holding charge can be calculated as:
Financing cost = financed amount × annual rate × days held ÷ day-count basis
The day-count basis and amount charged depend on the product’s terms. Use the relevant historical rate where possible. If the backtest only has a current rate or a broad estimate, label that limitation and test higher and lower assumptions. Apply borrow charges only to the short exposure they affect, and make the timing convention explicit.
Financing can change the relative appeal of otherwise similar strategies. A system that holds positions for several weeks may look sound before holding costs, then weaken after them. A strategy that frequently turns over but holds positions briefly can have the opposite profile. Report trading costs and holding costs separately before combining them, so it is clear which assumptions drive the result.
Calculate total cost from turnover
One way to organise a cost model is to estimate the expense for every trade, then add the costs across the test. For a simple percentage-based model:
Total transaction cost = traded value × cost rate per side × number of sides
Suppose a strategy buys $10,000 of an asset and later sells the full position. If the assumed all-in trading cost is 0.10% per side, the entry cost is $10 and the exit cost is $10, for $20 total. The estimate should not be called “all-in” if it excludes a known financing charge or tax; name the included components instead.
When a portfolio contains many assets or changing weights, calculate traded value from the change in position rather than from the portfolio’s full value at every signal. If the portfolio moves from a 20% weight to a 25% weight, the trade is the additional 5% allocation, not a fresh purchase of the entire 25%. For a long-short portfolio, track buys, sells, covers and short entries consistently.
Turnover is a useful diagnostic because it connects strategy activity to the cost bill. A backtest can report turnover alongside net return, number of trades, average holding time and average cost per trade. That helps explain why an apparently small per-trade charge becomes material after many entries and exits. Report gross results for comparison, but base practical conclusions on net results.
Test cost assumptions instead of hiding them
No cost model can guarantee that simulated fills will match future execution. Costs depend on market conditions and order details that historical data may not capture. The purpose of testing is to find out whether the strategy’s performance survives reasonable variation, not to locate a single cost setting that preserves a preferred result.
Run at least a baseline case and more demanding cases. Vary spread, slippage and market impact separately where possible, then test a combined higher-cost scenario. This reveals whether performance is sensitive to one assumption or only falls apart when several assumptions are stressed together. A strategy that remains profitable only at the lowest estimated costs deserves more scrutiny than one that tolerates a wide range.
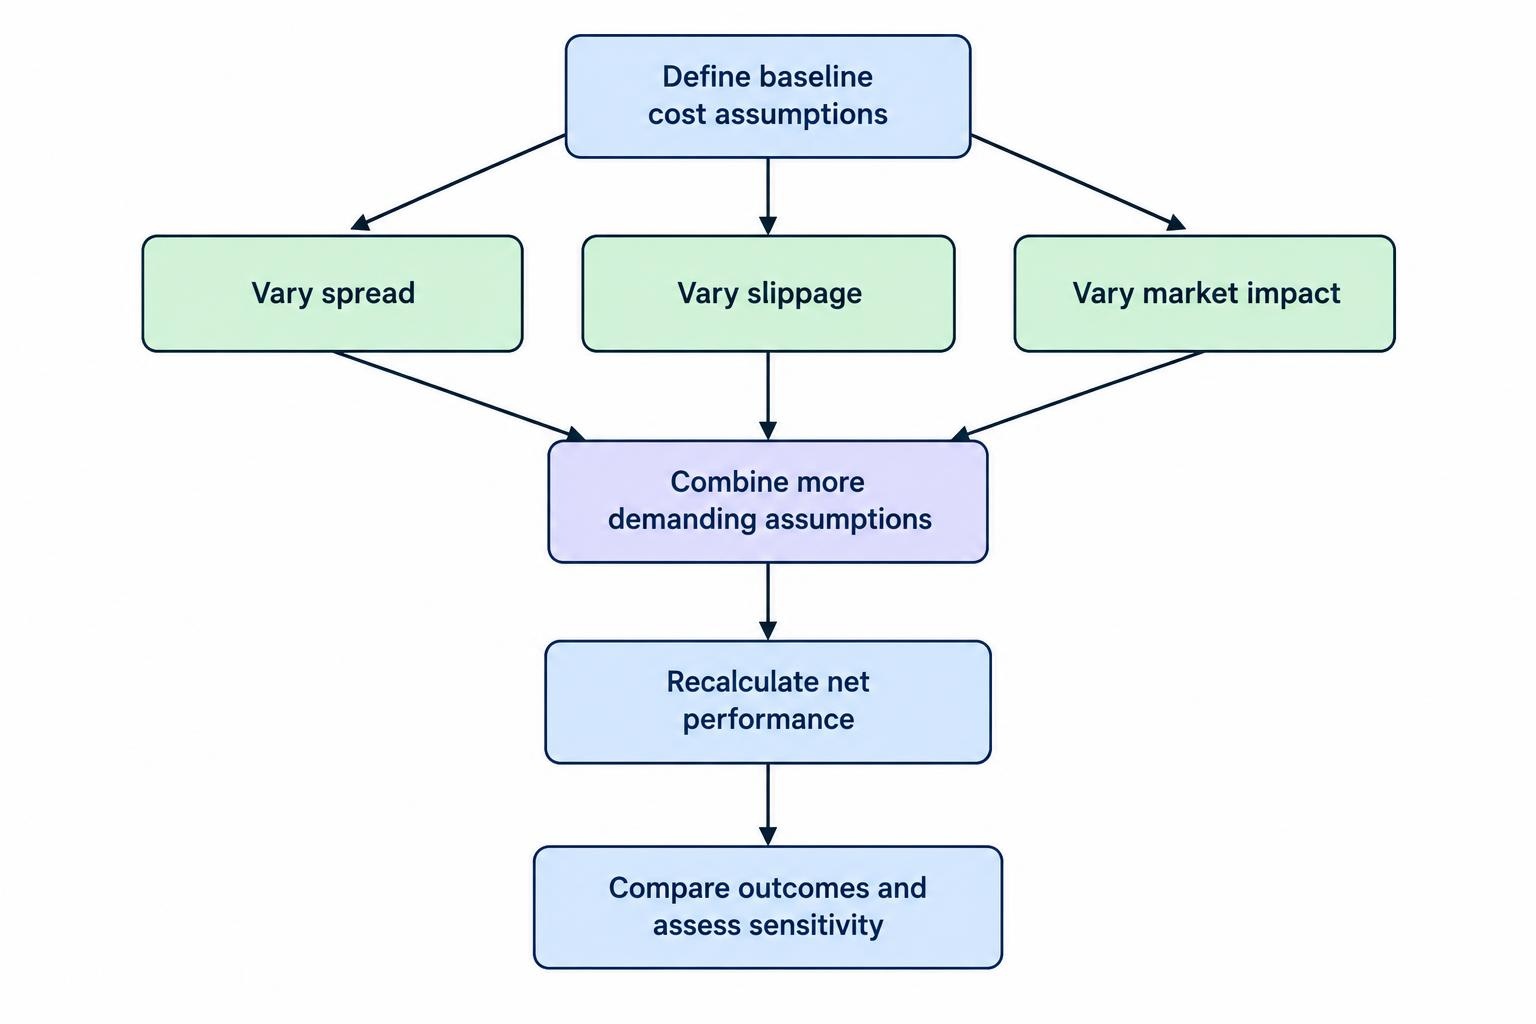
Compare the strategy’s expected return per trade with the estimated round-trip cost. If the average gross edge is smaller than the expected cost, more precise forecasting will not fix the arithmetic. This comparison is particularly useful for high-turnover systems, where a small cost error repeated across many trades can dominate the result.
Keep a record of each cost setting and do not tune the model on the final test period until the preferred result appears. Repeatedly adjusting assumptions against the same historical sample can turn cost analysis into another form of overfitting. Use a separate test period or a walk-forward evaluation to see how the strategy behaves as conditions change, and check that the data split prevents future information from leaking into earlier decisions.
Use net performance measures and fair comparisons
Subtract costs from returns before calculating performance statistics. Then measure results using the same net-return convention throughout the test. Win rate alone cannot show whether a strategy covers its trading costs: a high proportion of small wins may be offset by larger losses and frequent fees. Review return, drawdown, turnover and risk-adjusted performance together, with a clear account of what costs were included. The guide to measuring performance beyond win rate covers why a single statistic is not enough.
Apply consistent assumptions to the strategy and its benchmark. If the strategy rebalances more often than a buy-and-hold portfolio, the benchmark should still include the costs it would actually incur, but it should not be charged costs for trades it never makes. Compare strategies with the same asset universe, date range and cost conventions. A relevant benchmark comparison helps show whether the strategy’s extra trading earns enough to justify its additional expense.
Research on forecast-based trading reinforces the need to assess the whole strategy, not forecast scores in isolation. A 2024 Cardiff University study tested multiple strategies with transaction-cost approximations and found that costs reduced performance; the researchers also reported no correlation between their forecast test metrics and strategy performance in their evaluation. That result is not a universal rule for every market or system, but it illustrates why a good prediction score does not establish that a trade can be executed profitably. The paper, “The Impact of Transaction Costs on Forecast-Based Trading Strategy Performance,” also notes uncertainty in estimating realistic costs as a limitation.
Common cost-modeling mistakes
- Using zero costs. This can make a high-turnover strategy look better than its likely net performance.
- Charging a flat fee but ignoring the spread. Commission is only one part of the cost model.
- Double counting the spread. If orders already execute at bid and ask prices, do not subtract the full spread again.
- Using one cost rate for every asset and period. Liquidity, volatility, order size and trading hours can change execution costs.
- Assuming every limit order fills. A price touch does not prove that the order would have received a fill.
- Ignoring turnover and partial position changes. Rebalances and reductions generate trades even when the signal does not reverse.
- Applying financing to the wrong exposure or duration. Match the charge to the product, position size and holding period.
- Reporting only the best cost scenario. Show how results change when assumptions become less favourable.
A credible backtest states its price convention, cost components, per-side or round-trip treatment, and the source or rationale for each estimate. It separates costs that can be measured directly from those that require approximation. Most of all, it reports performance after costs and tests whether that performance survives less favourable assumptions. If the result depends on free trades, perfect fills or a spread that never widens, the backtest has not yet made a persuasive case.