Historical market data is the raw material for AI trading research. A model can be coded correctly and still learn the wrong lesson if its prices are adjusted inconsistently, its timestamps are misread, or its historical asset list excludes instruments that later failed. Data preparation is the work of making each observation mean what the model assumes it means, and making sure that information was actually available at the time the model would have used it.
This is not the same as making a chart look tidy. A clean research dataset should preserve the quirks that affect real decisions: exchange sessions, corporate actions, delisted securities, reporting delays and missing trades. It should also document what was changed, what was excluded and why. Those records make results easier to reproduce, and expose the errors that can otherwise make an AI strategy look far better in a backtest than it could have been in practice.
Define the research question before collecting data
Start by stating what the system will predict or decide. A model that ranks daily stock returns needs different data from one that reacts to intraday quotes or commodity inventory reports. Write down the instruments, trading venue, date range, bar frequency, decision time and intended holding period. Then specify the target: a future price, a return over a defined interval, a direction, or a probability tied to a rule. The target determines which observations must be available at each decision point, and when the result of each prediction can be measured.
This step prevents a common mistake: downloading every column a vendor offers and only later deciding what the model should learn. Extra fields can introduce accidental leakage, inconsistent definitions or an unmanageable cleaning task. A compact dataset with clear timing often supports better research than a sprawling file whose columns have uncertain meanings. If you are still choosing the target, separate that decision from data cleaning; the guide to choosing price, return, direction and probability targets covers how those prediction goals differ.
Record the research design in a short specification. Include the asset class, market hours, currency, data source, frequency, timezone, adjustment convention, universe rules and planned use of each field. Note whether the strategy may trade at the close, at the next open or only after a bar has finished. A daily bar stamped with its closing date may not be available until the session ends; treating it as known earlier can make the test use tomorrow’s answer to place today’s trade.
Choose a data source that matches the intended use
Historical data is not a single interchangeable commodity. Trade prints, quotes, candles, settlement prices and end-of-day summaries describe different things. A candle built from trades records the opening, highest, lowest and last traded price over an interval; it does not tell you every price a buyer could have obtained. Quote data shows available bid and ask prices, but a displayed quote is not proof that a particular order would have filled at that price or size. Choose the finest data that is genuinely needed for the research question, not the finest feed available.
For a slower strategy, daily bars may be sufficient to test the timing of signals. Intraday strategies usually need finer bars or trades, along with a careful account of how they are time-stamped and formed. Research on order-book behavior may require event-level messages. Each increase in resolution raises storage and processing needs, while also creating more opportunities to mishandle time, market hours and execution assumptions. Historical exchange data can include different market events: NYSE’s historical data product descriptions, for example, distinguish trades, top-of-book information, order-book depth and auction records.
Inspect a sample before committing to a dataset. Check the schema, time coverage, units, timezone, update frequency and licensing terms. Ask whether the historical feed includes delisted instruments, corrected records, corporate actions and exchange-specific sessions. Confirm that the source covers the actual venue or market your system is meant to trade. Two vendors may show slightly different values because they collect different trades, use different bar boundaries or publish corrections at different times. A mismatch does not automatically mean one feed is wrong, but it does mean results can depend on the provider.
Keep the provider’s field definitions with the data. A column called “volume” may refer to shares, contracts, lots, or a vendor-specific estimate. “Close” might mean the final eligible trade, an official closing auction price or a settlement value. A price field can be raw or adjusted. Never infer these details from the label alone. When documentation leaves a definition unclear, treat that field as uncertain until the provider confirms it or a comparison with a trusted source resolves the question.
Build a stable record for each observation
A useful market-data table gives each observation an identifiable instrument, event or bar time, source and value. A daily equity row might include a permanent security identifier, exchange, session date, open, high, low, close, volume, currency and adjustment status. An intraday record should also make the interval explicit, such as one-minute bars, and distinguish its start time from its end time. A timestamp without a timezone or bar convention is a half-finished fact.
Keep instrument identity separate from the ticker symbol. Tickers can change, be reused, or differ across venues. A stable identifier allows the research system to connect an issuer’s history across symbol changes without accidentally joining two unrelated securities. Store the effective dates for symbol, exchange and instrument changes where available. For futures, the contract month and expiry matter; a continuous futures series is a constructed research object, not a single contract that could have been traded throughout its full history.
Use consistent types and units. Parse dates as dates, timestamps as timezone-aware values, prices as numeric values and categorical fields as controlled labels. Store prices in a documented currency and volumes in documented units. Avoid mixing strings such as “N/A” with numbers in the same column; convert them to an explicit missing value and retain a reason code when one is known. These basic checks catch errors early, before a machine-learning pipeline silently converts a malformed column or treats an identifier as a numeric feature.
Retain the original files unchanged. Create a separate cleaned dataset or transformation step rather than overwriting source records. Record the vendor, file name, retrieval date, schema version, adjustment setting and any checksums or other file identifiers your workflow supports. If the source later changes, these details help distinguish a change in the market from a revised download. The broader AI system testing guide places data preparation alongside validation, cost modelling and other parts of a credible test.
Make timestamps and availability explicit
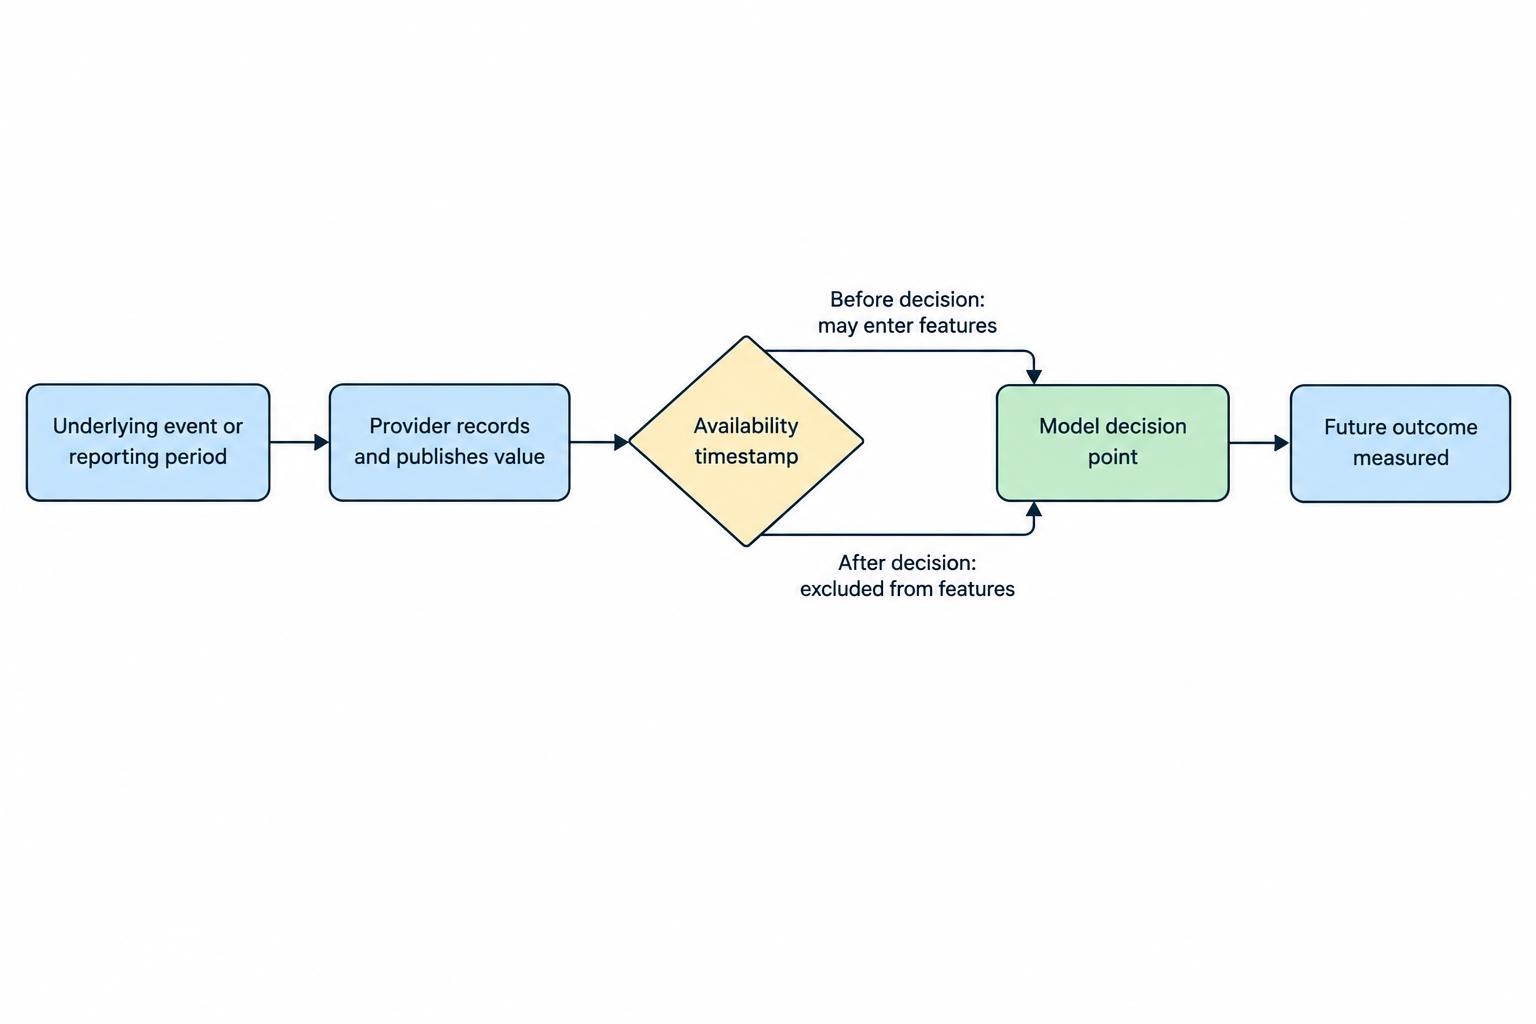
Financial data can carry several different times. An event has an occurrence time; a provider may record it later; a bar covers a period; and a research system may receive the record after the period has ended. These times are not interchangeable. For each field, identify when the underlying event happened and when a trader could first have known it. If a daily bar represents the full regular session, its final high, low and close cannot be used to make a decision earlier in that session.
Choose one internal timezone for timestamp handling, commonly UTC, and preserve the exchange’s local session calendar as separate metadata. Convert timestamps explicitly, accounting for daylight saving changes and exchange holidays. Do not assume every market opens and closes at the same local hour year-round. Some futures trade across long sessions, while equities may have regular sessions, auctions and shortened holiday sessions. A date-only timestamp can also hide whether a record refers to midnight, session close or a provider’s reporting convention.
Bars should have an unambiguous interval definition. If a one-minute bar is labeled 10:01, does it cover 10:00:00 through 10:00:59, or 10:01:00 through 10:01:59? Is the label the start or end of the interval? The answer varies by source and platform. A mismatch of one bar can make a strategy appear to enter at a price that was already known only after the decision point. Provider documentation should settle the convention, and a simple hand-check of several bars can confirm that your code follows it.
Fundamental data and economic releases need an availability timestamp, not just the period they describe. A quarterly earnings figure may refer to a quarter that ended weeks earlier; it becomes usable only when it is publicly released. Macroeconomic data can be revised after first publication. Using a modern, revised series as if every historical value had been known in real time gives the model information unavailable to traders at the time. ALFRED preserves data vintages and release histories; its documentation explains how historical versions of economic data can be retrieved. For exact revision and release timing, FRED’s series observations documentation describes real-time periods and vintage-date queries.
For each feature, ask a blunt question: “Could this value have been observed before the model’s decision?” If the answer depends on a publication schedule, vendor delivery delay or later correction, represent that timing. When data are released after the market close, a strategy that acts at that same close must not use the new value unless the feed and execution timing support it. Availability rules should be applied in the same way during training, validation and simulation.
Handle corporate actions and price adjustments consistently
Splits, dividends, symbol changes, mergers and delistings can alter a security’s history. A stock split changes the number of shares and quoted price; a dividend affects the value received by shareholders; a merger can replace one security with cash, new shares or both. Raw prices preserve the historical quoted values, while adjusted series restate past prices to account for later corporate actions. Neither representation is correct for every task. The appropriate choice depends on whether the strategy models traded prices, total returns, indicators or portfolio value.
Do not mix raw and adjusted data in one feature set without a clear reason. A price series adjusted for splits may be useful for comparing price patterns across time, but simulated orders still need plausible prices and share quantities on the date of the trade. Dividend-adjusted prices can behave differently from raw prices around ex-dividend dates. If a model trains on adjusted prices but the execution simulation uses raw prices, document the conversion and verify that holdings, cash flows and returns are accounted for consistently.
Look closely at what “adjusted” means in the chosen dataset. Some vendors adjust for splits only; others also adjust for cash dividends or produce total-return series. Adjusted history can be revised retroactively after a later corporate action. A backtest that downloads today’s fully adjusted history is not necessarily using the same numeric series that would have been available at each past date. Platform documentation also varies: QuantConnect describes how its adjustment modes change historical equity prices and how corporate actions can create differences between backtests and live data in its dataset issue documentation.
For model research, preserve the raw source and corporate-action records whenever possible. Then choose a representation for each purpose: price features, return calculations and portfolio accounting may need different treatments. Test known split and dividend dates manually. A large overnight price drop may be a data error, but it may also be a split, a cash distribution or a real market move. Automatically deleting all large moves is a quick way to erase the very events a risk model should learn to handle.
Keep the historical universe, including securities that disappeared
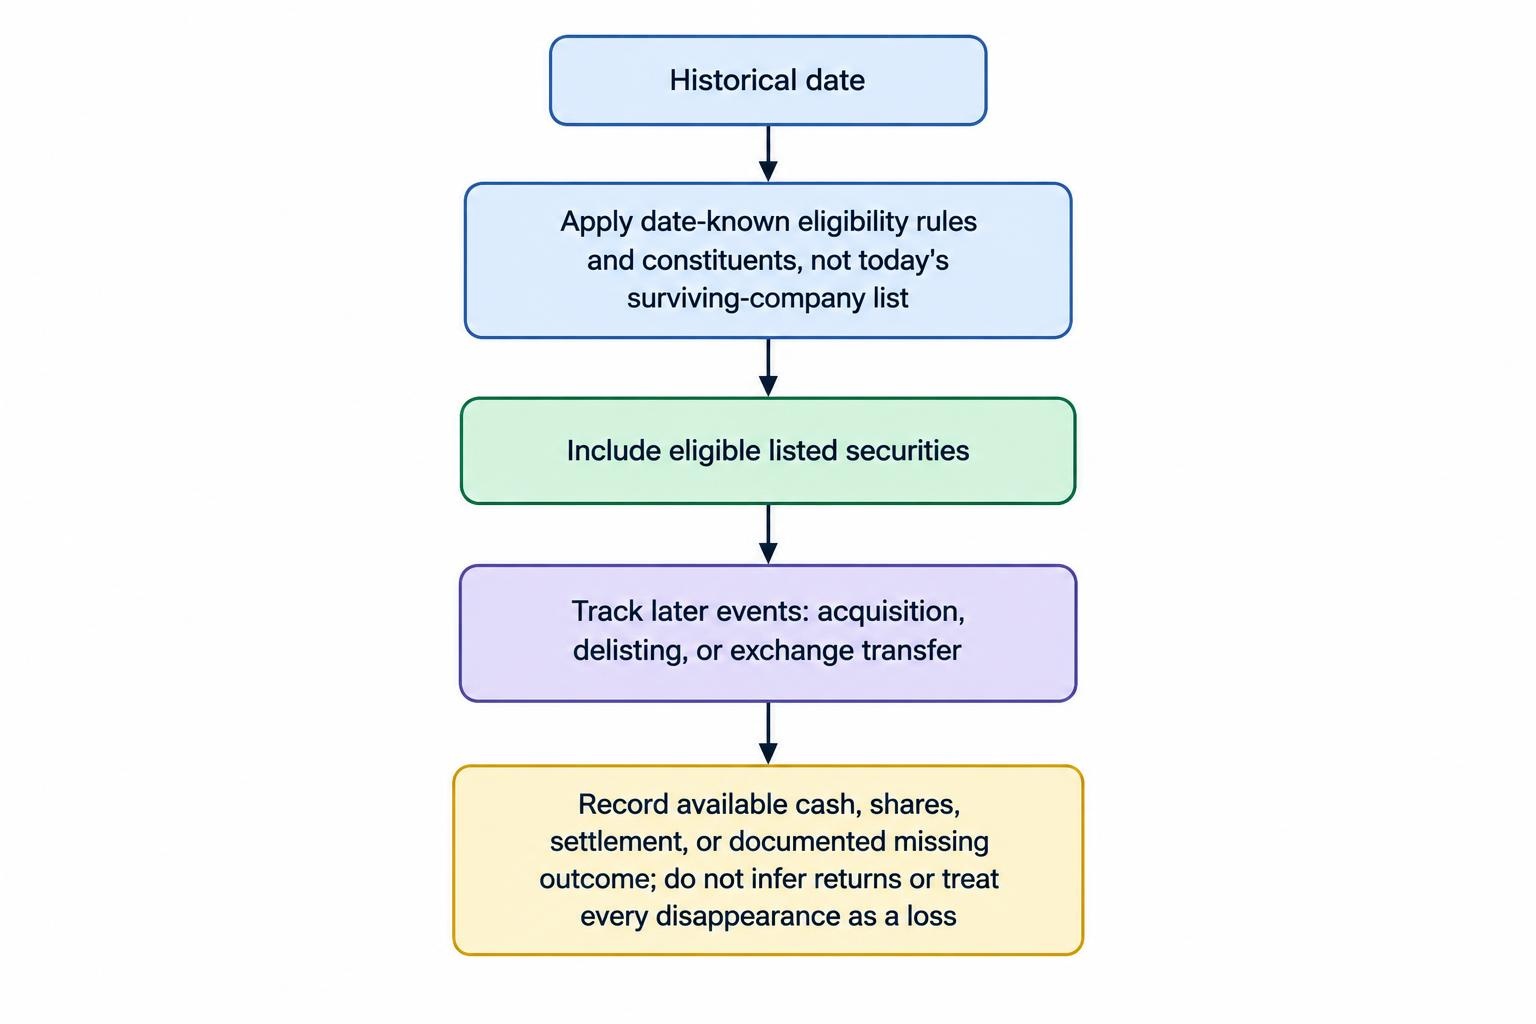
A historical stock universe should contain the securities that were eligible at each point in time, not just those that remain listed today. If a dataset retains only current companies, a strategy is evaluated on survivors and omits many securities that were acquired, delisted or failed. That omission can distort both the model’s training examples and its measured performance. Research on delisting returns documents how missing outcomes for securities removed from the market can affect historical return analysis; see Shumway’s study of delisting bias in stock return data.
Use point-in-time constituents when testing an index-based or rule-based universe. The current members of an index were not necessarily its members ten years ago. Reconstruct membership using effective dates for additions and removals, rather than applying today’s list to the full history. Likewise, a stock screen should use only companies and attributes that met its rules on the historical date. If the strategy would have selected securities based on market capitalization, liquidity or sector, calculate those values from data available then—not from a modern file that includes later classifications or revisions.
Delisted instruments need outcomes, not just a final row with no further price. Depending on the event, an investor may have received cash, shares in an acquiring company, or a final settlement value. When no reliable post-delisting return is available, mark the limitation rather than silently dropping the security or assigning it a convenient return. Separate the reason for disappearance where the source provides it: an acquisition is not equivalent to bankruptcy, and an exchange transfer is not necessarily an economic loss.
This work is especially relevant to screening and ranking models. An AI model trained on a hand-picked list of currently successful companies can learn traits associated with survival while appearing to predict returns. It has not been shown how it would have treated the companies that disappeared. The related guide to overfitting, look-ahead bias and data leakage explains why historical information must be filtered by what was knowable at the time.
Audit missing records, duplicates and unusual values
Missing data should be classified before it is filled. A missing bar may mean no trades occurred, the venue was closed, trading was halted, the instrument had not yet listed, the vendor feed failed, or the file was damaged. Those cases have different meanings. Filling every gap with the prior price creates artificial flat periods and may make an illiquid instrument look easy to trade. Removing every incomplete row can also bias the sample if gaps occur more often in stressed or thinly traded periods.
Use exchange calendars and instrument status records to separate expected closures from suspicious gaps. For intraday data, compare trade bars with quote data if both are available, and check whether the source defines a fill-forward bar. A filled bar is a software convention, not a new market trade. Keep a flag that distinguishes observed prices from carried-forward values. For daily data, verify whether a date is a valid trading session for that instrument’s venue, and account for early closes and trading suspensions.
Deduplicate records using an explicit key, such as instrument, event timestamp, event type and sequence number where supplied. Do not simply keep the last row in a file without understanding why the same key appears twice. One record may be a correction, a later venue message, or a separate trade with the same timestamp. If the provider publishes corrections, retain the correction history or use its documented final-record convention. Save counts of removed duplicates and the rule used to remove them.
Validate numeric values with rules suited to the instrument. Prices should generally be positive for ordinary cash equities, but other markets can have unusual quoting conventions or exceptional price behavior. Volume can be zero on a valid no-trade interval; negative volume is more likely a parsing or vendor issue. Check whether high is at least as large as open and close, and low no greater than them, while allowing for special cases and rounding. Flag extreme returns for review, but do not winsorize or delete them automatically. A genuine crash, bad tick and corporate action can all look extreme in a simple return chart.
Compare a small, random set of records with the original files and, where possible, a second reputable source. Also inspect the periods your strategy relies on: opening auctions, market stress, contract roll dates or major release windows. A dataset can pass broad summary checks while still having a serious defect in precisely the interval that drives the model’s results. Keep a data-quality report with missing counts, duplicates, outliers, corporate-action checks, date coverage and any unresolved issues.
Prepare features without leaking future information
Feature engineering must obey the same clock as trading. A rolling average at time t should use only observations available by t. A centered moving average, full-sample normalization or interpolation that uses later values can leak future information into the past. Likewise, do not calculate a company’s historical market capitalization using a share count or classification that became available later. The feature may look like a simple number, but its timestamp and source determine whether it could have informed a real decision.
Fit transformations on the training period only, then apply the stored transformation to validation and test periods. This applies to standardization, imputation, dimensionality reduction and feature selection. If a scaler uses the mean and standard deviation of the entire dataset, information from the test period has influenced the model before evaluation begins. Any transformation that learns parameters from data must be contained within the training process, not calculated once over the complete history.
When joining multiple datasets, match on both instrument identity and availability time. A daily price record and an earnings release may share a calendar date while having different times. A release published after the close should not be joined to a trade decision made at that close. For lower-frequency fundamentals, decide whether to carry the latest known value forward, and retain its age so the model can distinguish a fresh observation from a stale one. Never forward-fill across an instrument’s delisting or across a period when the value was not yet public.
Store raw inputs and derived features separately. Give each feature a definition, units, lookback window, source and timing rule. A column called “volatility” is not enough: specify the return frequency, window length and calculation. This makes it possible to reproduce features later and to identify a change when a vendor revises its raw data. For further guidance on selecting model inputs, see choosing price, volume, volatility and context features.
Split the prepared data in time order
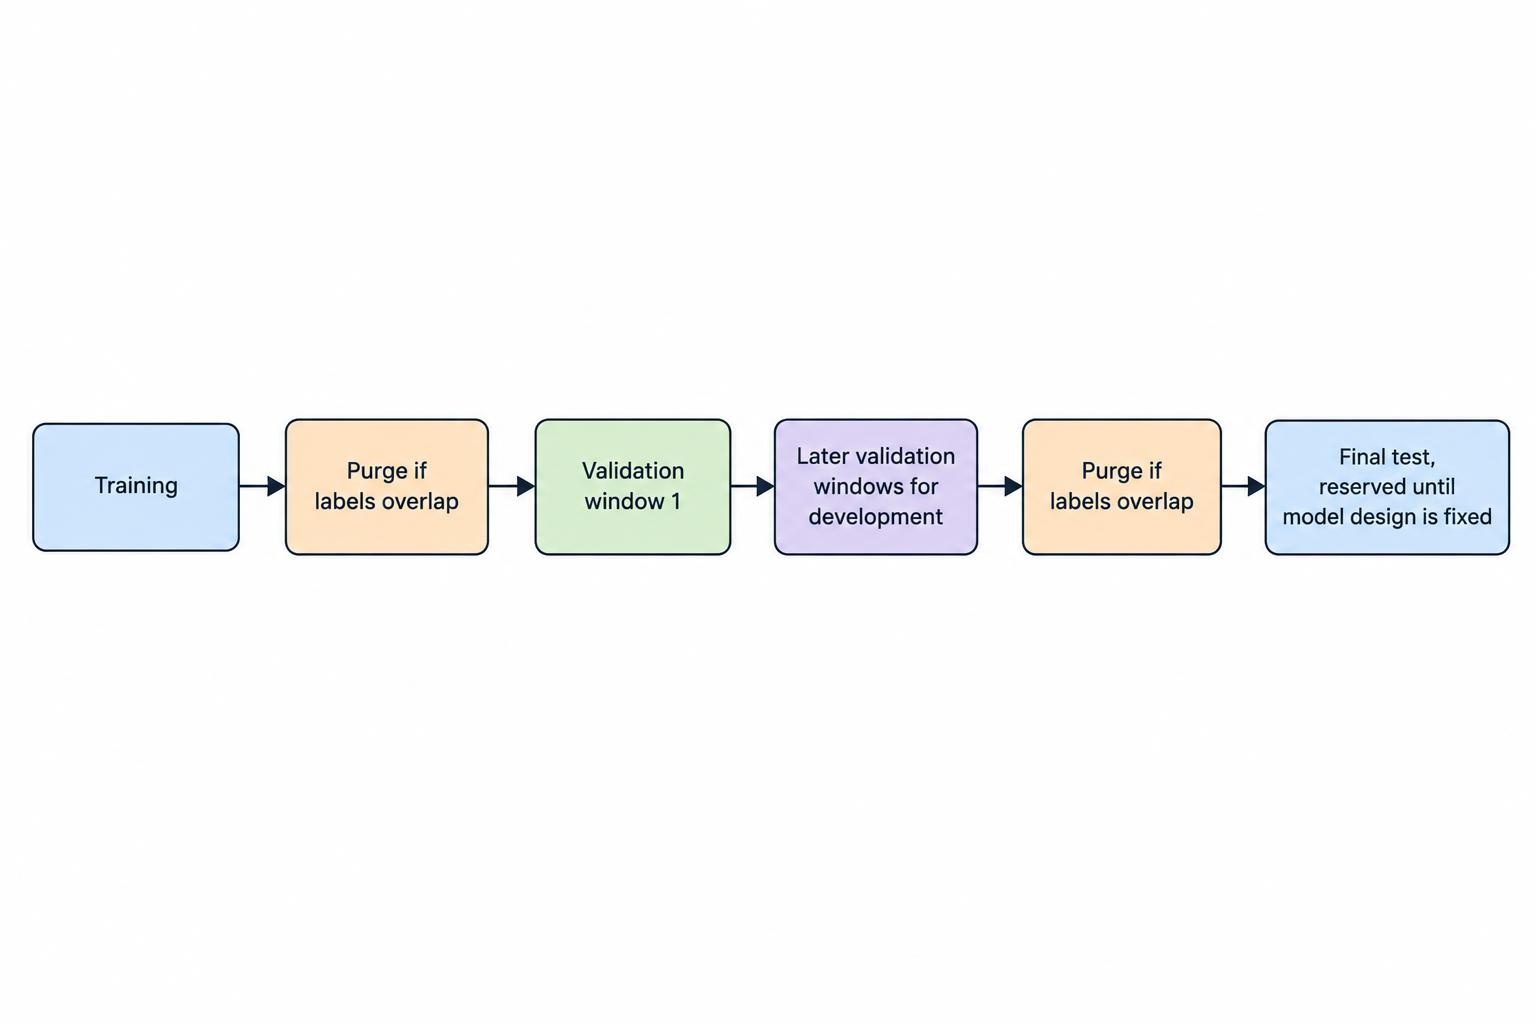
Once the observations are cleaned and aligned, divide the dataset chronologically. Randomly shuffling financial time series can place later market conditions in the training set and earlier periods in the test set. It can also distribute overlapping labels across both sides of a split. The model then gets an indirect preview of the test environment, even if the target column itself has been removed from the features.
Set aside a final test period before model selection, and do not use it to choose features or tune thresholds. Build validation periods that reflect how the system would have been developed and deployed. If labels overlap in time, leave a suitable gap between training and evaluation samples so information from a training label does not spill into the validation period. The details depend on the prediction horizon and sampling frequency; the guide to training, validation and test sets for financial time series covers time-ordered splits and their purpose.
A single chronological split can be fragile if one period is unusually calm or volatile. Repeating the training and evaluation process over several historical windows can show whether results depend on a narrow slice of the record. That process is distinct from cleaning the data: a model may be tested rigorously on a faulty dataset and still produce a misleading result. Keep the final test data isolated until the design is fixed, and log each experiment so the same period does not quietly become a tuning set after repeated inspection.
Make the dataset reproducible
A useful research dataset can be rebuilt from its source and transformation rules. Save the code or written steps that parse files, normalize timestamps, apply corporate-action handling, construct the historical universe and form model features. Record software and data versions, query parameters, retrieval dates and random seeds when they apply. If a vendor revises its history or a transformation changes, version the new dataset instead of silently replacing the old one.
Keep a concise data dictionary alongside the files. For each field, document its meaning, unit, source, timezone, availability rule and treatment of missing values. Add a data-quality report that records the number of instruments and observations at each stage. If cleaning removes 8% of a sample, the reason matters more than the percentage; a documented removal of corrupted rows differs from dropping every company with an incomplete history.
Before training, run a final set of checks: verify dates and timezones, confirm the asset universe at sample dates, compare adjusted and raw prices around known corporate actions, inspect delisted outcomes, and confirm that every feature was available before its prediction time. Then freeze the dataset used for that experiment. The process may feel less exciting than training another model, but it answers the question that performance charts cannot: whether the historical evidence actually represents the information and instruments the strategy could have faced.