Market regime detection is the process of estimating what kind of conditions a market is showing at a given time. A regime might describe a sustained trend, a sideways range, unusually high volatility, or a change in how assets move together. Traders use these estimates to decide whether a strategy is appropriate, whether risk should be reduced, or whether a signal deserves less confidence. The estimate is not a reliable label stamped onto the market. It is a model’s reading of recent data, and it can be wrong.
For a retail trader using AI, the practical goal is usually modest: identify conditions that may affect a strategy’s behavior, then test whether reacting to those conditions improves decisions after costs. A regime detector does not need to predict the next market crisis to be useful. It might simply flag that volatility has risen above a level where a short-term strategy has historically struggled. That use sits within AI trading strategies and signal development, but it should be treated as a filter or risk input, not a standalone trading system.
What a market regime describes
A regime is a period in which selected market characteristics behave in a relatively similar way. The word “selected” matters. A market can trend upward while volatility is high, or move sideways with low volatility. It can also show rising prices in one asset and falling prices in another. A single label such as “bull market” or “risk off” may hide these differences.
It is often clearer to describe conditions along separate dimensions. Trend measures capture direction and persistence; range measures capture how often price reverses or remains within recent bounds; volatility measures capture the scale of price movement. A model may also track liquidity, volume, correlations or the relationship between an asset and a broader market. These dimensions can overlap, and a regime can change on one dimension before changing on another.
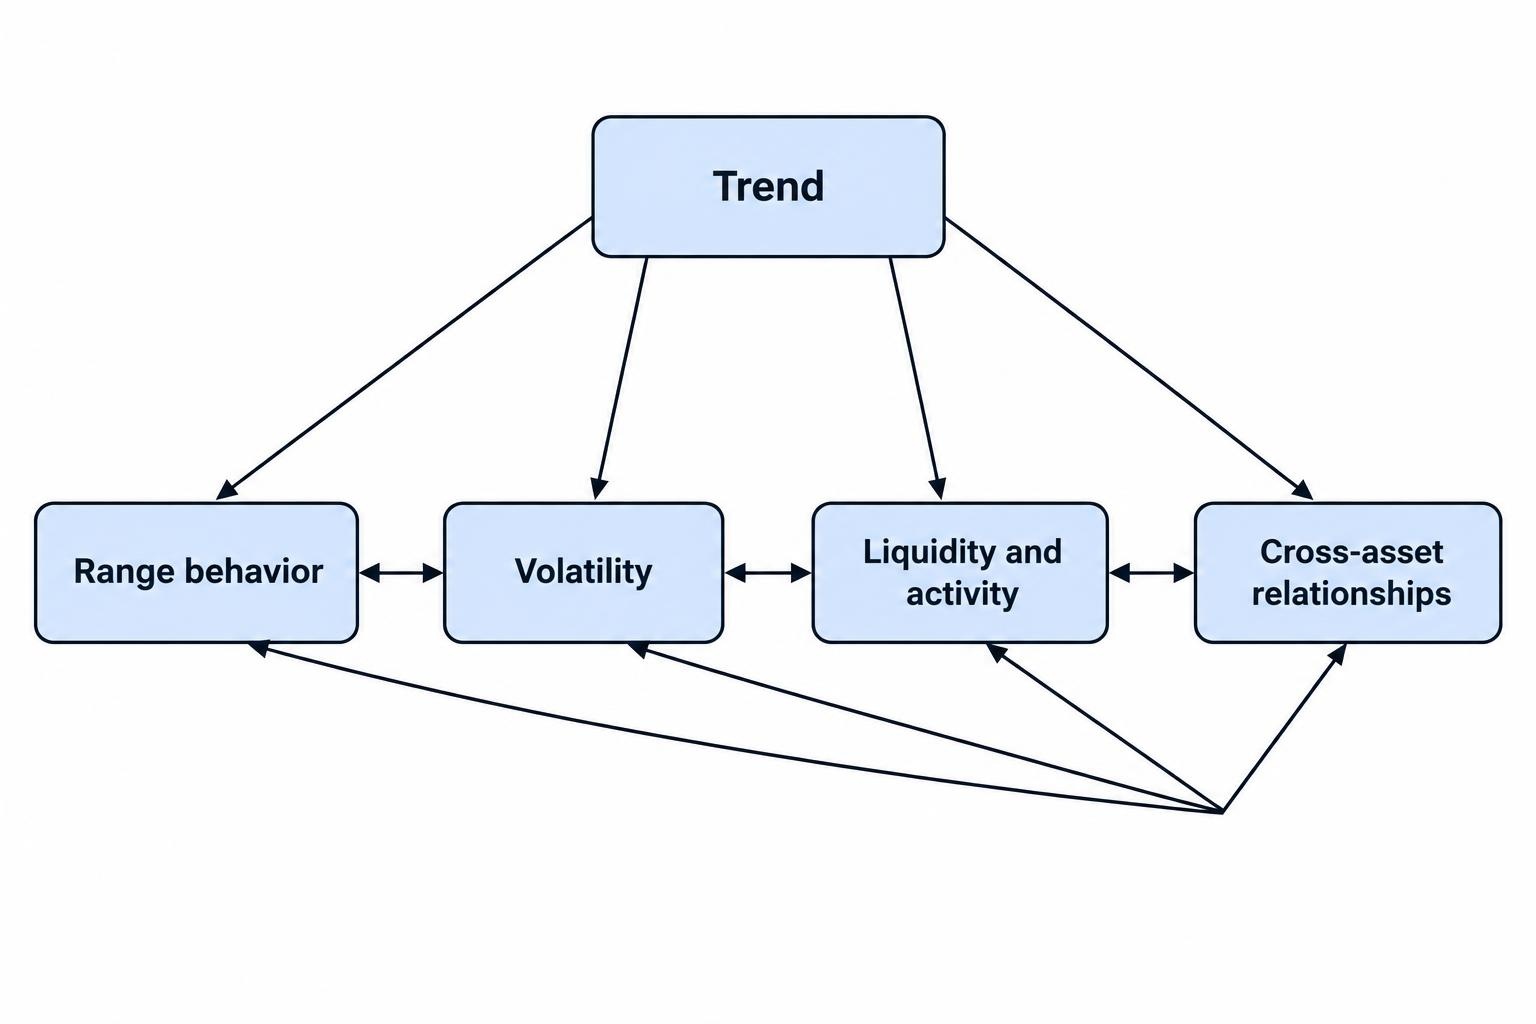
| Dimension | What it describes | Possible use |
|---|---|---|
| Trend | Direction and persistence of price movement | Check whether a trend following signal has supportive conditions |
| Range behavior | Whether prices repeatedly reverse or remain within a band | Assess whether a mean reversion setup is worth considering |
| Volatility | The scale and variability of price changes | Adjust position size, stop distance or trading frequency |
| Liquidity and activity | How much trading activity is available and how it changes | Account for wider spreads or harder execution |
| Cross asset relationships | How markets or instruments move in relation to one another | Review diversification and shared exposure |
These are descriptions, not forecasts. A high volatility reading says that price changes have been large relative to the chosen measure and window. It does not say that prices will fall, or that volatility will remain high. Similarly, a detected trend does not establish that the trend will continue. A regime estimate is most useful when its meaning is defined in advance and tied to a decision the trader can test.
Why traders use regime detection
Many strategies depend on conditions that do not stay constant. A breakout rule may behave differently in a quiet range than during a strong directional move. A mean reversion approach may face larger losses when price is moving persistently in one direction. A short-term system can also become less attractive when volatility and transaction costs rise together. Regime detection can help identify these differences, provided the signal is available before the trade decision.
There are several ways to use an estimate. A trader might allow a strategy to trade only when a condition is present, reduce exposure when the model reports uncertainty, or compare a signal’s historical behavior across different environments. A trend filter, for example, could require evidence of direction before a trend following entry is considered. A range filter could cause the same system to stand aside when price action is choppy. How to filter trend following signals depends on the strategy’s own rules; the regime label should not quietly replace them.
Regime estimates can also help with review. If a strategy underperforms, the trader can check whether losses cluster in certain conditions, or whether the model’s regime assignments changed after the fact. This is diagnostic, not proof that a new filter will improve returns. Adding a rule because it explains a past loss is easy. Showing that it helps on data the rule did not see is harder.
Choose the regime question before choosing a model
Start by writing down what decision the estimate is meant to inform. “Detect market regimes” is too broad to test. A workable question might be: “Does recent volatility identify periods when this strategy’s drawdown risk rises?” Another could be: “Can a trend measure distinguish conditions where this entry rule has positive expectancy from conditions where it does not?” These questions set the asset, time frame, data, features and evaluation method.
The target also shapes what “regime” means. If the purpose is risk control, a volatility state may be enough. If the purpose is selecting between trend and range strategies, direction and persistence may matter more. If the decision concerns a portfolio, relationships among assets might be relevant. Keep the target narrow at first. Every extra feature or category adds choices, and choices made after inspecting results can produce a filter that fits history rather than market behavior.
Define the categories in practical terms. “High volatility” could mean a rolling measure above a threshold estimated from earlier observations. “Trend” could mean a directional measure exceeds a pre-set level over a chosen period. An unsupervised model may produce clusters without clear names; the trader then has to inspect what distinguishes them. The names are interpretations, not model outputs with universal meaning. A regime called “crisis” in one dataset may simply mean “the most volatile observations in this sample.”
The trading decision should be stated just as clearly. Does the detector block entries, lower position size, change a model’s confidence, or select between two strategies? If nothing changes when the label changes, the detector has no operational purpose. If several things change at once, it becomes difficult to tell which rule helped or hurt.
Data and features used to identify conditions
Price returns, rolling volatility, moving averages, range measures, volume and drawdown are common inputs. Depending on the market and question, a model might also use spreads, market breadth, interest rates or relationships between assets. Each input should be available at the time the decision is made. A feature built from a completed bar cannot be used to make a decision earlier in that bar unless the test models that timing accurately.
Feature selection should follow the question, not a hunt for the largest available dataset. A volatility filter needs a sensible volatility measure and time window. A trend classifier needs inputs that represent direction or persistence. A detector for a portfolio may need cross asset information. The guide to choosing features for a trading model covers the tradeoffs between price, volume, volatility and context.
Data quality can change the result. Missing bars, bad prices, adjusted historical data, different trading hours and changes in market structure can all affect the features. Match the data to the intended instrument and trading schedule, and document how it was cleaned. Keep the sequence of events intact; regime detection is a time series task, so randomly shuffling observations can mix later conditions into earlier training data. A practical review of historical market data preparation helps catch issues before model comparison.
Common approaches to regime detection
Threshold rules
A threshold rule uses one or more indicators and assigns a state when a condition is met. A rolling volatility value above a threshold might mark a high volatility state. A trend strength measure above a separate threshold might mark a directional state. These rules are easy to inspect and can be a good baseline. Their weak point is sensitivity: a small change to the window or threshold may alter many labels, especially near the boundary.
Thresholds should be chosen using only the training period or a pre-defined rule, then held fixed when evaluating later data. Recomputing a threshold with the full history can leak future information into the past. Adding a buffer or requiring a condition to persist may reduce rapid switching, but that adds delay. That delay is part of the strategy and must appear in the test.
Change point detection
Change point methods look for a shift in the statistical behavior of a series, such as a change in average return or volatility. They can be useful for identifying that conditions have changed without requiring the trader to name every state in advance. A method can be retrospective, locating a break after observing data on both sides, or sequential, raising an alert as new observations arrive. Retrospective break dates can be useful for analysis, but they may not be available in real time at the same date.
For live use, the detector must operate using information available up to that moment. A change point that appears obvious on a chart months later may have been uncertain when it began. The system should record when it first raised the alert, not only the date later assigned to the break.
Clustering
Clustering groups observations that look similar across selected features. A trader might cluster periods using return, volatility and trend measures, then inspect whether the resulting groups correspond to recognizable conditions. Clustering is unsupervised: it does not know what “good” or “bad” means for a strategy. The groups can be mathematically distinct and still provide no useful trading information.
One research approach combined principal component analysis, k-means clustering and classification to identify market states and assign later observations to states learned from training data. That illustrates a possible workflow, not a guarantee of trading value. The authors also noted limits in relating model performance to the resulting strategy outcomes. The financial regime detection study using clustering and classification is useful for seeing how labels can be created and applied out of sample.
Hidden Markov and switching models
Hidden Markov models and related switching models assume that observed data are generated under an unobserved state that can change over time. Rather than asserting that each observation belongs with certainty to one state, the model can estimate probabilities for different states. This is useful when conditions shift gradually or the data do not support a crisp boundary.
The probabilities need careful interpretation. A model may say there is a 60% probability of one state and 40% of another; that is uncertainty, not a promise that the first state will occur. Some implementations estimate state probabilities using later observations as well as earlier ones. Those smoothed estimates can be appropriate for historical analysis, but they are not a fair representation of what a trader could have known in real time. A live system needs filtered or otherwise point-in-time estimates.
Complexity is not a mark of quality. The Federal Reserve’s 2025 discussion paper, revised in September 2026, compared machine learning methods with econometric models for realized volatility forecasting and found that relative performance varied by forecast horizon; machine learning did not systematically outperform the broader econometric set. That work concerns volatility forecasting rather than a universal test of regime detection, but it reinforces a useful point: compare a complex model with credible simpler alternatives. See the Federal Reserve study of volatility forecasting models.
Turn a regime estimate into a testable rule
Once the detector produces a label or probability, define exactly how the trading system uses it. For a binary filter, the rule might permit a strategy only when a condition exceeds a pre-set probability. For a risk adjustment, the system might lower exposure gradually as estimated volatility rises. For a strategy selector, the system might choose between a trend approach and a range approach. Each version has different assumptions and needs its own test.
A useful starting comparison is the original strategy without a regime filter, the same strategy with one simple filter, and a simple alternative such as fixed risk reduction. This helps reveal whether the detector adds value or whether the result comes from trading less. Compare net returns and risk measures, not a single accuracy score. If you are considering AI-assisted mean reversion, test whether the proposed range conditions would have been identifiable at the time and whether the entry and exit rules remain viable once trading costs are included.
Choose a forecast horizon that matches the decision. A daily regime estimate may be poorly suited to a strategy that enters and exits within minutes. A slow moving signal can still be useful for position sizing over days or weeks, but it will not time a fast entry. Likewise, a model trained to predict next week’s volatility does not necessarily identify whether a price is trending today. Keep the question, feature window and action on compatible time scales.
How to test a regime detector
Use chronological splits. Train the detector on earlier observations, tune it on a later validation period, then assess it on data that was not used for model choice. A random split can place nearby observations from the same market episode in both training and test sets, making the task easier than it would be in live use. The details of training, validation and test sets for financial time series matter just as much for a regime model as for a return prediction model.
Check for leakage in every step, not just the final model. Normalization, feature selection, threshold choice and clustering must be fitted within the training window. If the model’s labels are created using the full sample, information from later periods may influence how earlier regimes are defined. A careful review of overfitting and data leakage helps keep the test closer to a live process.
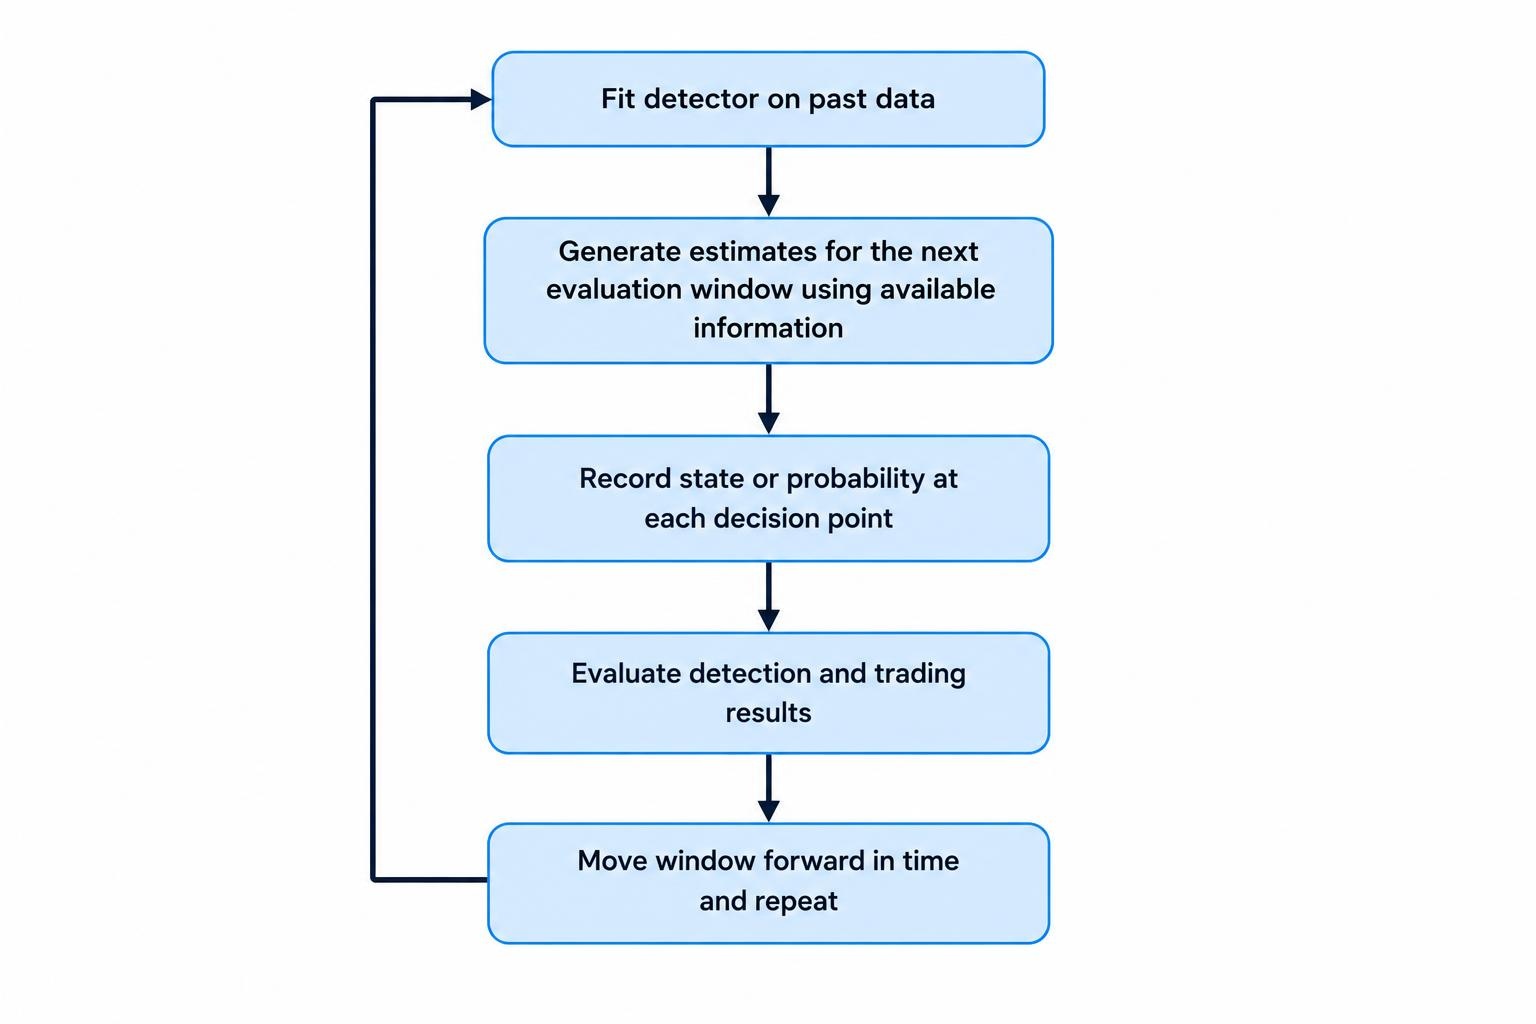
Walk forward through time when the intended system will be updated. Fit the model using past data, generate estimates for the next evaluation window, then move the window forward and repeat. Record the state or probability available at each decision point. This can show whether the model’s labels remain stable, whether the detector reacts too late, and whether re-estimation changes the result. A walk-forward evaluation should preserve the same retraining schedule and information limits expected in operation.
Evaluate both the detection and the trading effect. For detection, ask whether states are interpretable, persistent enough to act on, and distinguishable using information available in real time. For trading, compare net performance, drawdown, turnover and exposure with a baseline. Include fees, spread, slippage and financing where relevant. A detector that improves a classification score but adds costly trading or misses the early part of a move may have little practical value. The article on including trading costs in backtests covers these adjustments.
Also test whether the regime rule adds value beyond a simple benchmark. The benchmark might be the unchanged strategy, a fixed volatility target or a basic threshold rule. Report results across multiple periods rather than selecting the most attractive stretch. A filter that works only in one crisis or one bull run may be a description of that sample, not a durable decision rule. Compare the system with simple rules and relevant benchmarks before adding more model layers.
Common failure modes
- Too many labels: More states can make the model harder to interpret and leave too few observations in each group.
- Labels that switch constantly: A detector that flips back and forth may create churn, delayed trades or confusing risk changes.
- Confusing description with prediction: A model may identify current volatility without forecasting future returns.
- Using future-informed labels: Smoothed probabilities or retrospective break dates can make a historical chart look more timely than a live system would be.
- Ignoring strategy fit: A regime can be statistically clear yet irrelevant to the entry, exit or risk rules being tested.
- Retraining without controls: Frequent updates may change labels and thresholds in ways that were not represented in the backtest.
Regime definitions can also drift. The market may change its volatility, liquidity or correlations, while the detector keeps applying thresholds estimated under earlier conditions. Track the distribution of inputs, the frequency of each state and the strategy’s results within each state. A change in those measures is a reason to investigate, not an automatic instruction to retrain. Retraining can help, but it can also fit noise or erase a useful distinction.
Use regime detection as a measured input
A regime detector earns its place only when it improves a defined decision under a fair test. Start with a small number of interpretable features, compare a simple rule with more complex models, and preserve the information available at each historical decision point. Treat probabilities as estimates, labels as model-dependent descriptions, and historical performance as evidence to test rather than a promise to repeat.
For many retail systems, the most defensible use is modest: flag conditions that warrant smaller exposure, prompt a strategy review, or help explain where a rule has struggled. If the detector adds delays, unstable labels or costs without improving the decision, it is extra machinery. A chart with four colored market states may look tidy. The live result still has to justify the colors.