Trend following uses an asset’s recent price movement to decide whether to hold, buy, sell or stay out. An AI filter can help sort those signals by context, such as volatility, trading volume or the strength of the move. Its job is to judge whether a basic trend signal meets a defined set of conditions. It does not know where prices are headed, and a high model score is not a promise of profit.
A useful system starts with a simple rule that can be explained without machine learning: for example, buy when price rises above a moving average and exit when it falls below. The model then answers a narrower question, such as whether the signal has performed reliably in comparable conditions. That separation makes it easier to test whether the filter adds value or simply makes the rules harder to inspect. It also connects the model’s prediction to a decision the trader can actually make.
What the AI filter is deciding
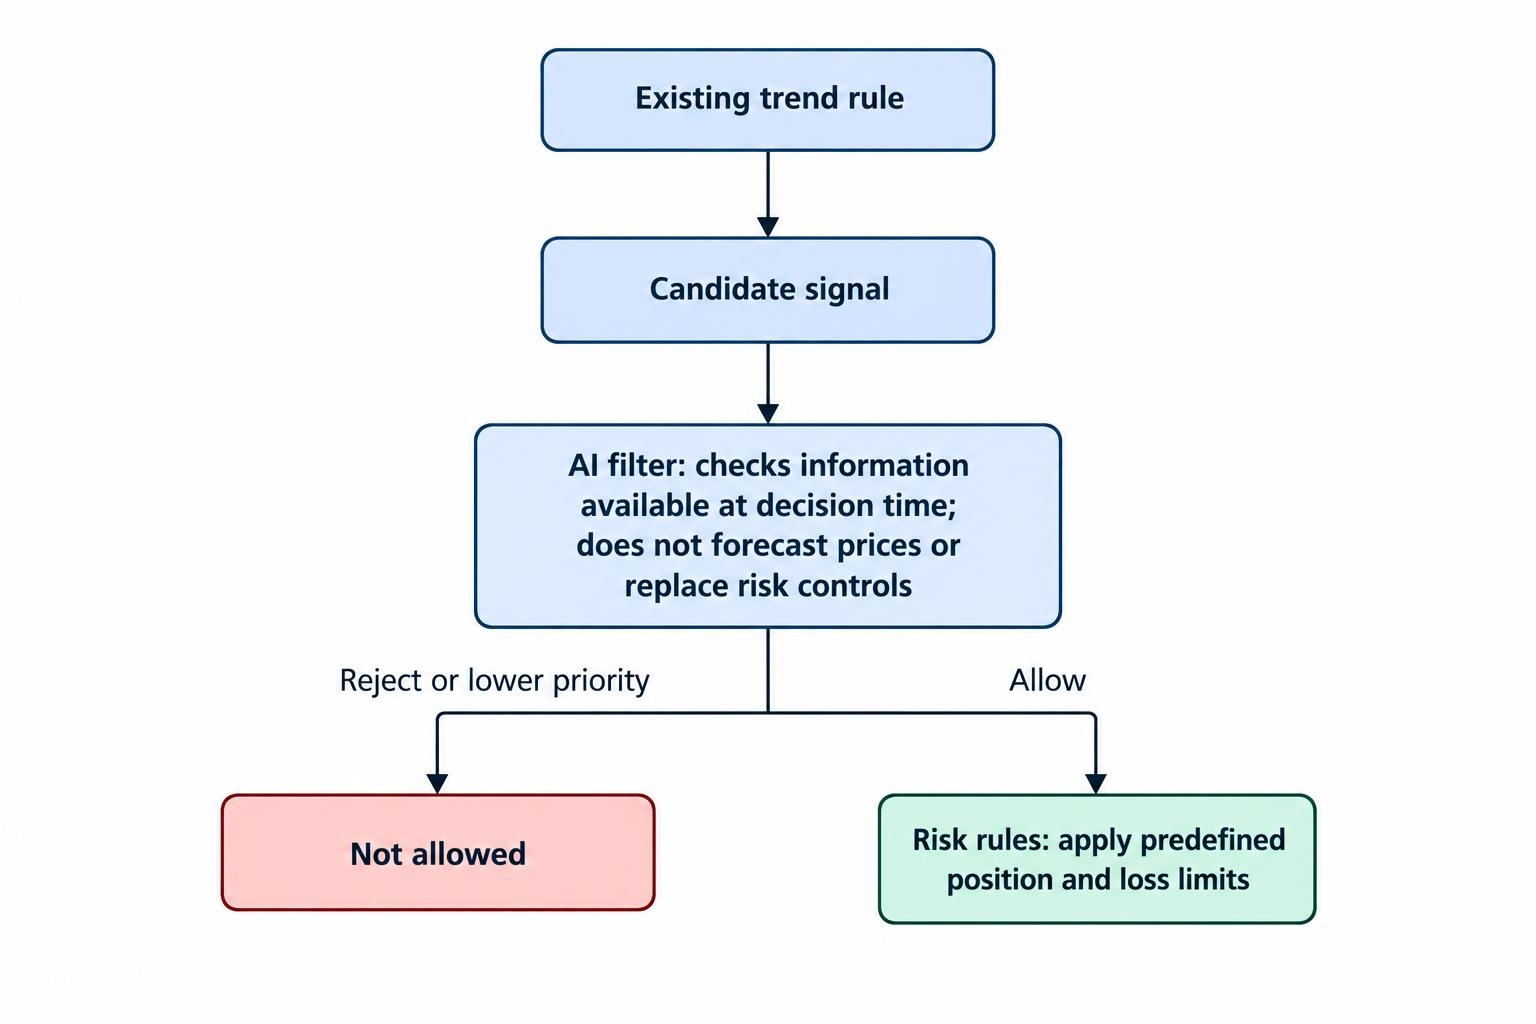
A trend rule produces a candidate signal. The filter evaluates that candidate using information available at the time, then allows it through, rejects it or reduces its priority. A simple filter might compare the current trend’s strength with recent volatility. A more involved model could combine several price and volume measures, but the decision should remain clear: does this setup qualify under a rule established before the test?
That is different from asking a model to forecast the next price, generate a complete strategy, and decide position size all at once. A filter is an extra condition layered over an existing trend method. It can help reduce exposure to weak or noisy signals, but it can also exclude profitable trades and delay entry. The relevant question is not whether the model sounds sophisticated. It is whether the filtered strategy performs better than the same trend rule without the filter, after costs and across data the model did not use during development.
| Part of the system | Practical question | Example |
|---|---|---|
| Trend rule | What creates a candidate signal? | Price closes above a chosen moving average. |
| AI filter | When should that signal qualify? | Only when the trend score exceeds a threshold and market data passes quality checks. |
| Risk rule | How much exposure is allowed? | Limit position size using a predefined risk budget. |
| Review rule | When should the system pause or be reassessed? | Stop trading if data, order handling or model outputs fail a defined check. |
Build the filter around a clear trend rule
Write down the underlying trend method before choosing a model. Specify the asset universe, trading timeframe, entry and exit conditions, and what happens when a signal is missing. A rule based on daily closing prices is not the same as one that reacts to intraday price changes. If the definition shifts during testing, it becomes difficult to tell whether an apparent improvement came from the AI filter or from changing the strategy itself.
Trend rules can use moving averages, recent returns or breakouts from a previous price range. These approaches measure related aspects of price direction, but their timing and trading frequency can differ. A moving average may react slowly to a turn; a breakout rule may enter after price has already moved. Research comparing momentum and moving average rules treats them as related but not identical methods, so the filter should be tested with the actual rule it will accompany, rather than a convenient substitute. ([papers.ssrn.com](https://papers.ssrn.com/sol3/Delivery.cfm/SSRN_ID3293521_code356177.pdf?abstractid=3293521&mirid=1&utm_source=openai))
Keep a baseline version of the strategy with no AI filter. That baseline gives the test a fair comparison. If the filtered version has fewer trades, compare more than the total return: check how much time it spent exposed to the market, how often it traded, and how its losses and gains were distributed. A filter can appear better simply because it takes less risk or happens to avoid one unusually bad period. Comparing both versions on the same dates, assets and cost assumptions helps reveal what changed.
Choose inputs the filter could have known
Potential inputs include recent returns, moving-average distance, price range, realized volatility, volume and the number of recent price swings. Market context can also be represented with measures such as whether several related assets are moving in the same direction. These are candidate features, not proven sources of an edge. Include a feature only when its meaning is clear and its value could have been calculated at the moment the system would act. The guide to choosing features for a trading model covers how to organize those inputs.
For example, a model might estimate whether a candidate signal is likely to achieve a positive return over the next five trading sessions, before a chosen exit condition. That requires a precise outcome definition: when the holding period begins, how the exit is calculated, and whether the outcome includes fees. The model then scores the setup using past information. A score of 0.7 should not be treated as a 70% chance of a profitable live trade unless the estimate has been tested and calibrated for that purpose. The score is a model output, not a fact about the market.
Avoid feeding the filter values that were revised after the decision time. Daily volume, for example, is not fully known before the trading session closes. A feature calculated using the final closing price cannot justify an order placed earlier that day. Similar timing problems can creep into adjusted price histories, economic releases, and labels that overlap across training and test periods. The article on overfitting and data leakage explains why these errors can make a historical result look stronger than a deployable one.
Decide what the model should predict
Many filters predict a category, such as whether a trend signal will meet a minimum return threshold over a stated period. Others estimate a return or rank candidate signals from stronger to weaker. Each choice has trade-offs. A positive-versus-negative label is simple to interpret, but it ignores how large gains and losses are. A numerical return forecast retains that difference, but return estimates can be noisy and sensitive to extreme outcomes.
Keep the prediction connected to the trading decision. If the system only needs to reject the weakest signals, a ranking or pass/fail threshold may be enough. If the decision is how much capital to allocate, the model needs to be evaluated alongside a position-sizing method and risk limits. A prediction of direction alone does not determine the size of a trade or how much loss is tolerable. More detail on this distinction is available in the guide to prediction targets for trading models.
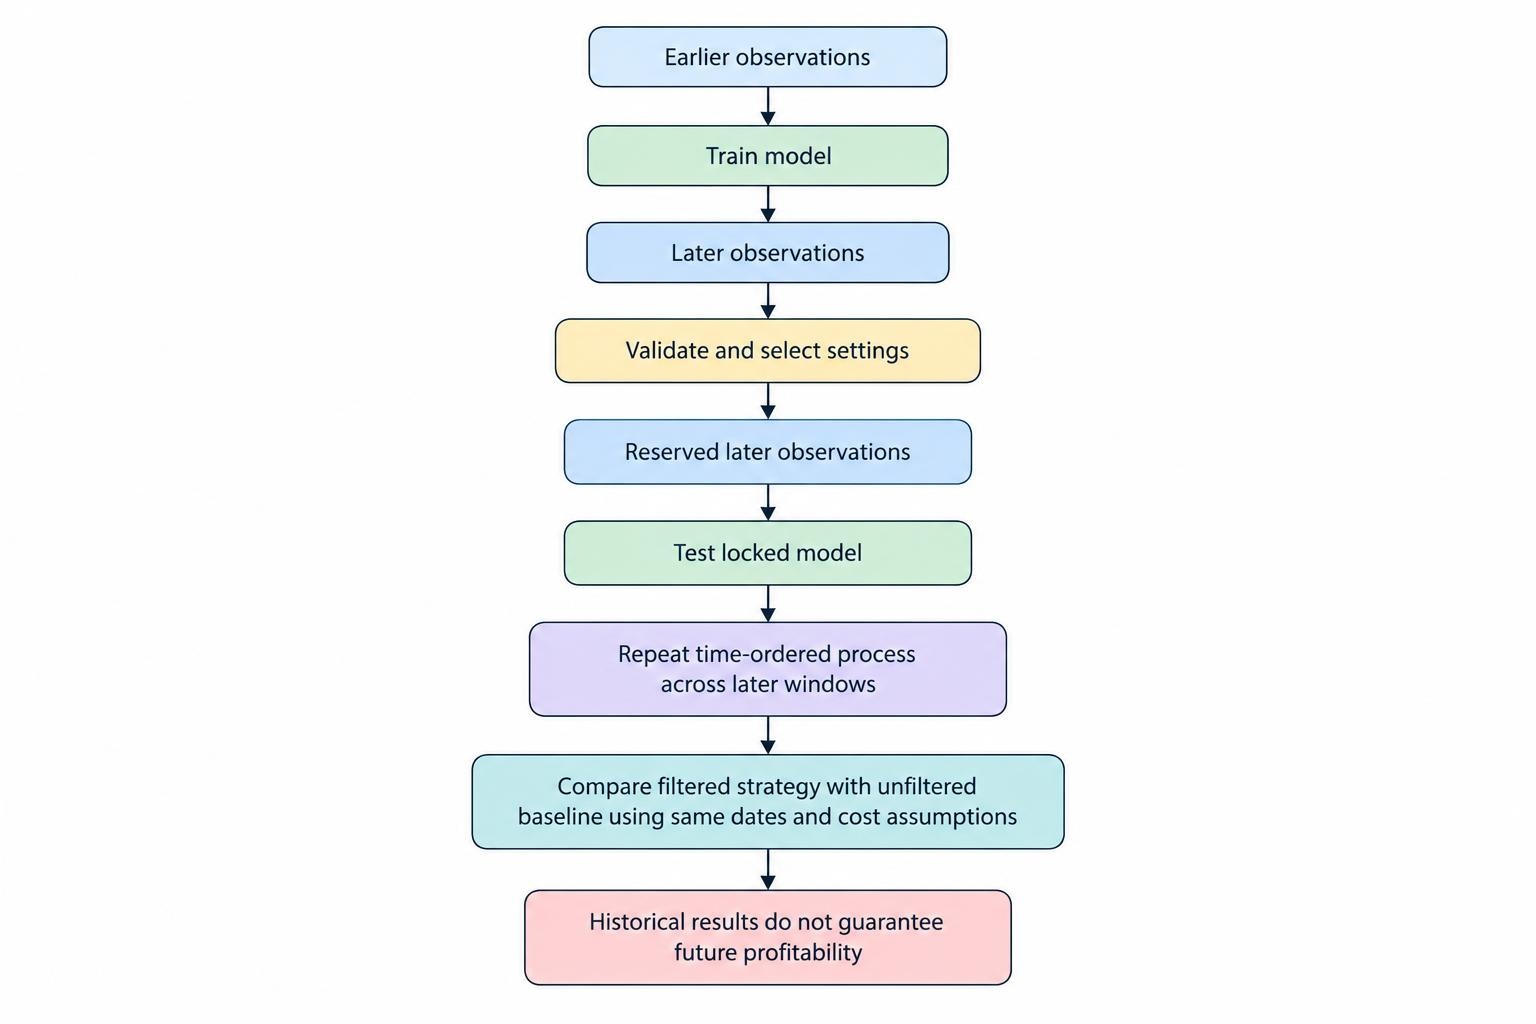
Set the target horizon to match the strategy’s decision cycle. A model trained to judge what happens over a month may not help a rule that exits after two days. When the signal overlaps across multiple days, avoid assigning nearly identical periods to training and testing as if they were independent. The testing design needs to preserve the order of time: train on earlier observations, validate on later ones, and reserve a final period that was not used to select the filter.
Test whether the filter adds value
Start with a modest model and a small, preselected group of features. Test it against the unfiltered trend rule and a simple non-AI filter, such as a fixed volatility limit. If a more complex system cannot beat these comparisons under the same assumptions, its added complexity has not earned a place in the workflow. Avoid repeatedly adjusting thresholds after reviewing the test results. Each new adjustment is another opportunity to fit the model to historical noise.
Use a chronological evaluation process. Train on the earliest period, choose settings using a later validation period, and assess the locked model on a final period that was kept aside. Then repeat the process across later windows using a walk-forward test. This checks whether the filter could have been developed with information available at each point, rather than with a view of the whole history. A single favorable period is weak evidence of a repeatable effect.
Include trading costs in both versions. A filter might reduce the number of signals but make little difference to fees, or it might shift entries and exits enough to change spread and slippage. Those costs depend on the instrument, venue, order size and execution conditions, so a model tested with frictionless prices can give a misleading comparison. Apply consistent assumptions and show how the results change if costs are less favorable than expected.
Review performance measures beyond the win rate. Compare net returns, drawdowns, volatility, turnover and how long the strategy remained in the market. Check performance by asset and by market condition, not only as one blended number. A filter that looks useful in a rising market may reject too many signals during a choppy stretch, or may fail when volatility changes. Trading performance metrics help distinguish a high proportion of winning trades from a strategy with acceptable losses and costs.
Trend following has been studied across long historical periods and multiple markets, but that evidence is not proof that a particular AI filter will work. One long-run study examines time-series momentum across markets and historical conditions; its findings describe the tested trend-following approach, not a guarantee for a new model, instrument or implementation. ([aqr.com](https://www.aqr.com/Insights/Research/Journal-Article/A-Century-of-Evidence-on-Trend-Following-Investing?utm_source=openai)) A filter needs its own tests, and those tests must include a fair comparison with the rule it is meant to improve.
Use market conditions as context, not certainty
Trend strategies can behave differently during persistent moves and sideways price action. A filter might use recent volatility or the consistency of price movement to identify conditions associated with stronger or weaker historical results. But a label such as “trending market” is not a reliable forecast by itself. A sharp move may reverse; a slow trend may continue despite modest momentum readings. The model should measure conditions that can be defined and tested, rather than assigning confident-sounding names to uncertain periods.
Market regimes can also change while the model is running. A filter trained in one environment may reject signals too often or allow weak ones through when volatility, liquidity or correlations shift. Review results over time and set a process for investigating performance changes, rather than retraining automatically whenever a short run of losses appears. The guide to market regime detection covers the difference between describing current conditions and claiming to predict what comes next.
Set a practical threshold and fallback
Choose a pass threshold using training and validation data, then lock it before final testing. A low threshold allows more candidate trades; a high threshold rejects more. Neither is inherently safer or more profitable. If a model produces poorly calibrated scores, ranking signals may be more defensible than treating each score as a precise probability. The threshold should also be tested for sensitivity: if a tiny adjustment changes the result dramatically, the apparent edge may depend on a fragile setting.
Define what happens when the model cannot produce a valid score. Missing inputs, stale prices, unexpected values or a failed connection should not quietly become approval to trade. The system can skip the signal, fall back to the baseline rule, or pause pending review. Which choice fits depends on the strategy, but it must be set in advance. Keep the underlying rule visible so a trader can determine why a candidate was accepted or rejected.
For a manual workflow, the model can rank signals and display the inputs behind each score, leaving the trader to apply established risk rules. For an automated workflow, the filter should pass a clear decision to a separate order process with position and loss limits. A model score should not bypass those controls. The guide to using AI as a trade filter explores this role without assuming that every decision needs to be automated.
Know what a successful filter can establish
A well-tested filter can show that, under stated data, rules and cost assumptions, it improved a particular historical evaluation relative to a defined baseline. It cannot establish that the same effect will persist, that all losing trades will be avoided, or that a given score predicts a guaranteed result. Model updates, data changes and execution differences can all change performance. Paper trading can help check whether the data feed and decision process work as intended, though simulated fills do not establish live profitability.
Keep a record of the model version, inputs, threshold, signal time and decision for each candidate trade. Review accepted and rejected signals on the same schedule, including cases where a rejected signal would have performed well. That record helps identify whether the filter is behaving as designed or whether the apparent improvement depends on a small cluster of trades. The goal is a narrow, testable improvement to a transparent trend rule, not a black box that claims to know which way the market will move.