A trading journal records what you did, what you knew at the time, and how the trade turned out. AI can help sort those records, compare decisions, and flag questions worth reviewing. It cannot turn incomplete notes into reliable evidence. If entry reasons are vague, prices are missing, or losing trades are absent, an AI summary may sound polished while describing a distorted picture of your process.
The useful role for AI is analysis, not judgment by default. A trader can use it to group similar setups, check whether planned rules were followed, or find recurring differences between winning and losing trades. The output is a starting point for review. It is not proof that a strategy works, a diagnosis of trading behavior, or a recommendation to place the next trade.
What to record before asking AI to analyse a journal
Good analysis starts with records that preserve the decision as it looked before the result was known. For each trade, record the instrument, date and time, direction, position size, entry and exit, fees, and result after costs. Add the setup or strategy name, the reason for entry, the planned exit or invalidation point, and whether the trade followed your rules. A brief note on market conditions can help too, provided it uses consistent categories rather than a different story for every trade.
Keep planned information separate from what happened later. If the journal only says “good setup” after a profitable trade, it becomes hard to tell whether the idea was sound at entry or whether the result has changed your memory of it. Save the original plan, then add a separate review field after the trade closes. If you use screenshots, label them with the instrument and timestamp. A folder of unnamed chart images is less a dataset than a scavenger hunt.
| Journal field | What it helps review |
|---|---|
| Setup and entry reason | Whether similar trades followed a consistent idea |
| Planned risk and exit | Whether the trade matched the plan, regardless of outcome |
| Entry, exit, size, and costs | Results after fees and other trading costs |
| Market context | Whether results differ across predefined conditions |
| Rule adherence and notes | Where execution or process departed from the plan |
Use stable labels for recurring setups, market conditions, and rule breaks. A category called “trend pullback” should not mean one thing in January and another in March. If you change a definition, record the change and the date it took effect. Without that discipline, an AI system may group unlike trades together or split the same kind of trade across several labels. For more on consistent inputs, see the guide to preparing historical market data for AI research.
Preserve the underlying trade records rather than treating an AI-generated report as your official ledger. Account statements and trade confirmations can help you check whether the journal’s dates, prices, and transaction details are accurate; the SEC’s recordkeeping guidance for investors also recommends keeping records of securities transactions. A journal is a decision-review tool, not a substitute for account records or tax documentation.
Questions AI can help investigate
Ask questions that can be answered from the fields you actually recorded. You might compare rule adherence across setups, check whether trades taken outside your usual session had different results, or count how often an exit plan changed after entry. AI can also group free-text notes into draft categories, such as “entered before confirmation” or “moved stop.” Treat those groupings as suggestions: read the notes behind each label and correct obvious mistakes before drawing any conclusion.
Start with descriptive questions, not causal ones. “How many trades were tagged as setup A, and what was their average result after costs?” asks for a calculation. “Does setup A cause better performance?” asks for more than a journal can usually establish. Trades may differ in market conditions, size, execution quality, or selection. A pattern in one collection of past trades might reflect those differences, chance, or a few unusually large outcomes.
- How often did I follow the planned entry and exit rules?
- What were the median result and the range of results for each setup?
- Did outcomes differ between planned trades and trades marked as rule breaks?
- Which entries have missing or contradictory notes?
- What findings might be driven by a small number of trades?
Ask the system to show its working in a form you can verify: the number of trades included, the filters applied, the fields used, and the calculation behind each statistic. A percentage without a denominator is easy to misread. “Seventy percent of trades followed the plan” means something different if the journal contains ten trades than if it contains a thousand. Check a sample against the original records, and calculate important figures independently when practical.
Separate trade outcome from decision quality
A profitable trade can break the plan; a losing trade can follow it exactly. Reviewing only the profit or loss encourages outcome bias: judging a decision by what happened afterward instead of by the information and rules available at the time. Record process measures separately from financial results. For example, a journal might track whether a valid setup appeared, whether the planned risk was used, and whether the exit followed the stated rule, alongside the net result.
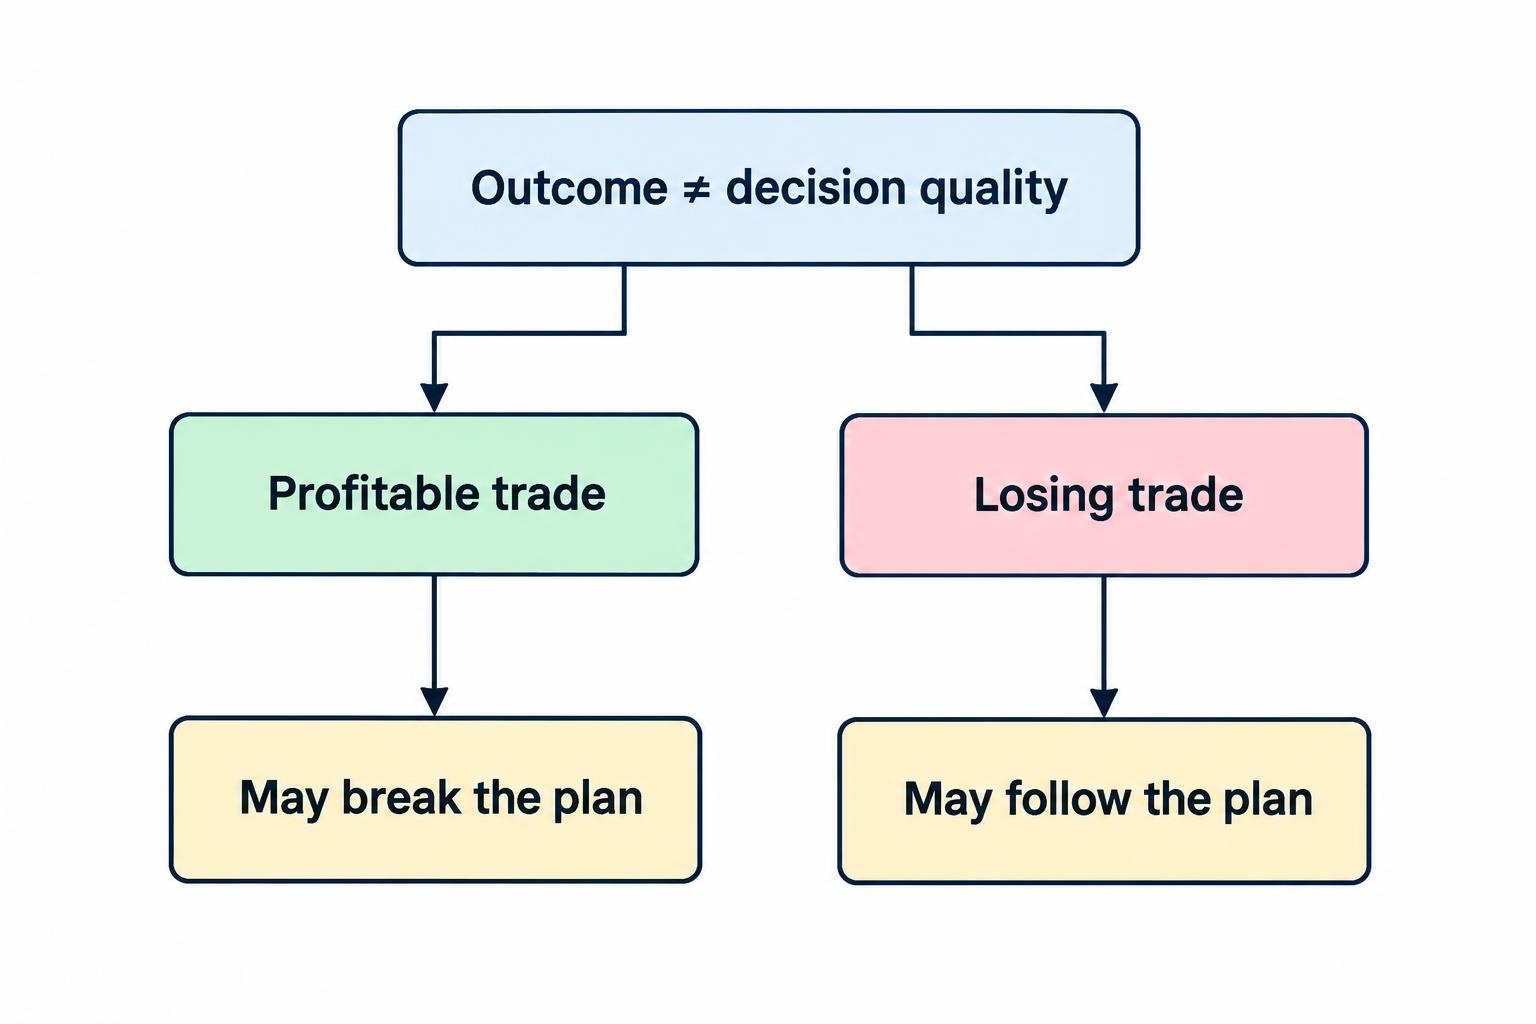
AI can help identify cases where those measures diverge. It might find that a group of trades earned money despite repeated rule breaks, or that properly executed trades lost during a particular period. Neither observation proves what to change. A cluster can be small, labels may be inconsistent, and the strategy itself may have changed. Use the result to select trades for closer review, not to declare a new rule based on a convenient slice of history.
Be careful with averages. A few large gains can make an average look strong even when most trades lost money; a few unusually bad trades can drag it down. Review the number of observations and a range of measures, such as median result, largest loss, and performance after costs. If you compare strategies, use the same date range and include comparable trade types. Broader guidance on measuring trading performance beyond win rate can help keep the review from collapsing into one headline number.
A practical AI review process
Use a repeatable process so each review is easier to compare with the last one. First, export a copy of the journal and check that dates, position sizes, and results are present and consistent. Decide which period and trade types you want to examine before looking at the outcome. Then ask AI to describe the data, flag gaps, and suggest patterns. Verify the calculations against the records, read the trades behind any proposed category, and write down what you will review next time.
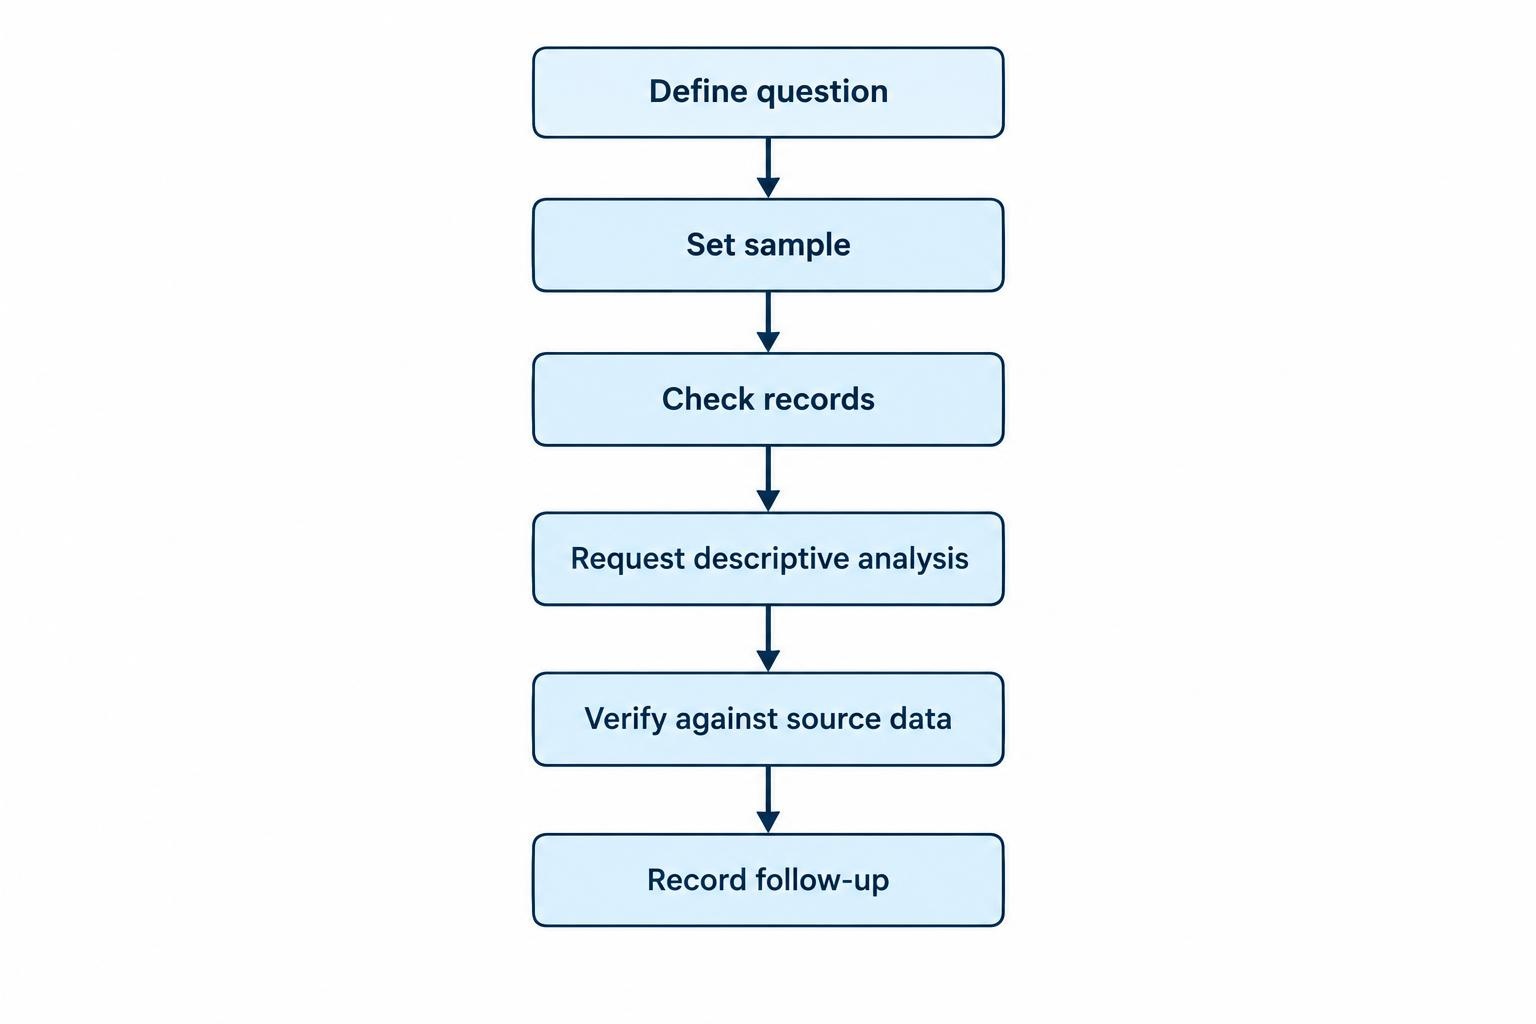
- Define the question. Keep it narrow, such as whether planned exits were followed in a particular setup.
- Set the sample. Specify the date range, instruments, and trade categories; note exclusions.
- Check the records. Look for duplicate rows, missing costs, inconsistent labels, and impossible values.
- Request a descriptive analysis. Ask for counts and calculations before asking for interpretations.
- Verify the result. Inspect examples and recompute important figures from the source data.
- Record a testable follow-up. State what you will track in the next review, without changing several rules at once.
A prompt can set useful boundaries: “Use only the attached journal fields. Count trades by setup and report the sample size, median net result, and number with missing exit notes. Do not infer causes or recommend trades. Show which rows were excluded and why.” The exact wording matters less than the discipline: give the model a defined task, restrict it to the supplied evidence, and ask for outputs that can be checked. This fits into a broader AI-assisted trading workflow, where research, decision-making, and review remain distinct steps.
Where AI analysis can go wrong
Language models can misread columns, invent explanations, or present uncertain conclusions in confident prose. Spreadsheet and analytics tools can also produce misleading results if a formula is wrong or records are filtered incorrectly. A model may treat blank notes as “no rule break,” confuse gross and net profit, or compare categories with very different sample sizes. Check the result against the data rather than judging it by how neatly it is written. The guide to AI hallucinations and source verification covers why fluent output still needs checking.
Small samples call for restraint. If you took only a handful of trades in a category, a strong or weak result may say little about its future performance. Repeatedly asking different questions until one produces an attractive pattern creates another problem: you can find apparent winners by chance. Write down the question before running the analysis, keep a record of changes to your strategy, and separate exploratory observations from tests you intend to rely on. For strategy-level claims, use a proper validation process rather than treating a journal summary as a backtest. The guide to testing and validating AI trading systems addresses that separate task.
AI analysis also depends on what the journal leaves out. If the record omits spreads, commissions, financing, or execution differences, a result based on gross profit can overstate what a trader received. If the journal records only completed trades, it may miss skipped signals or changed plans. Notes written after the fact are especially hard to interpret as evidence of what the trader believed beforehand. These gaps do not make review pointless, but they define what the data can support. Mark missing fields plainly; do not let a model silently fill them with assumptions.
Protect journal data and keep a human review
Trading journals may contain account identifiers, position history, financial details, or personal notes. Before uploading a file to an AI service, check its data handling terms and remove information that is not needed for the analysis. A table with anonymized trade IDs may be enough; account numbers and names usually are not. Keep a secure original copy, control who can access it, and avoid pasting credentials or API keys into a prompt. See the guide to protecting financial data when using AI assistants for more on handling sensitive information.
Keep the final judgment with the trader. AI can highlight a streak of late entries, but it cannot determine from a spreadsheet alone whether a setup remains valid or whether the rules were sensible in the first place. Review the underlying examples, check the analysis against your written plan, and note uncertainty alongside any proposed change. A useful journal review ends with a clearer question to monitor, not an instruction to increase size or take a trade.
Turn observations into a review plan
After checking an AI-generated analysis, record what it found, which trades it included, and what you could not verify. Choose one process question to monitor in the next review, such as whether early exits occur more often in a certain setup. Keep the original rules stable while collecting comparable records, unless there is a clear reason to change them. If you do change a rule, date the change and keep the earlier trades separate from the new version. This makes later comparisons more useful and reduces the temptation to rewrite the past to fit a result.
The best use of AI in a trading journal is modest and concrete: organize records, surface possible patterns, and make review questions easier to ask. The trader still needs to verify the data, distinguish process from outcome, and decide whether a finding deserves further testing. A tidy report can save time. It cannot repair weak records or make a noisy sample conclusive.