AI chart analysis uses software to identify patterns or conditions in price charts, then presents them as labels, measurements, alerts, or forecasts. A tool might flag a possible breakout, classify a sequence of candles, compare the current chart with historical examples, or summarize a chart in plain language. These outputs can help traders review more markets and apply rules consistently. They do not tell you what a chart “really means” or guarantee that a pattern will lead to a profitable trade.
The phrase covers several different technologies. Some systems analyse numerical price and volume data; others inspect chart images with computer vision; AI assistants may describe an image or answer questions about it. The distinction matters because a confident description is not the same as a tested trading signal. Before assessing an AI chart tool, identify what it reads, what it produces, and how its output could be checked against data that was not used to build it.
What AI chart analysis can identify
Most chart tools look for repeatable features. Those can be simple, such as a close above a recent high, or more involved, such as a sequence of rising lows followed by a volatility expansion. A system may report the feature as a category, a probability, a score, or a marked region on the chart. The output is only as clear as its definition: “bullish pattern” is vague, while “daily close above the highest close of the previous 20 sessions” can be checked.
Pattern recognition can help reduce repetitive screening. A trader who watches a long list of instruments might use software to flag charts that meet a defined condition, then inspect a smaller set by hand. Some models also group periods that look similar, find recurring shapes, or measure how often a chosen setup was followed by a particular outcome in historical data. Such results describe a sample, not a promise about the next occurrence.
AI chart analysis can also help organise observations. A tool might label price swings, calculate distances from recent highs, or identify whether volatility has risen relative to a chosen baseline. Those measurements can make a subjective chart-reading routine more consistent. For guidance on how chart tools differ from other products in the broader category, see AI trading tools and platforms.
Three ways a system can read a chart
| Approach | What it processes | What to check |
|---|---|---|
| Rule based detection | Numerical prices or indicators tested against fixed conditions | Whether the rule is precise, reproducible, and applied using data available at the time |
| Machine learning on market data | Price, volume, volatility, indicators, or other structured variables | How the target, inputs, training period, and out of sample results are defined |
| Computer vision or image analysis | Rendered chart images, sometimes with labels or indicators | Whether chart formatting changes the result and whether the model can explain its output |
| Language model image description | A chart screenshot and a written prompt | Whether the answer matches the underlying data and separates observation from inference |
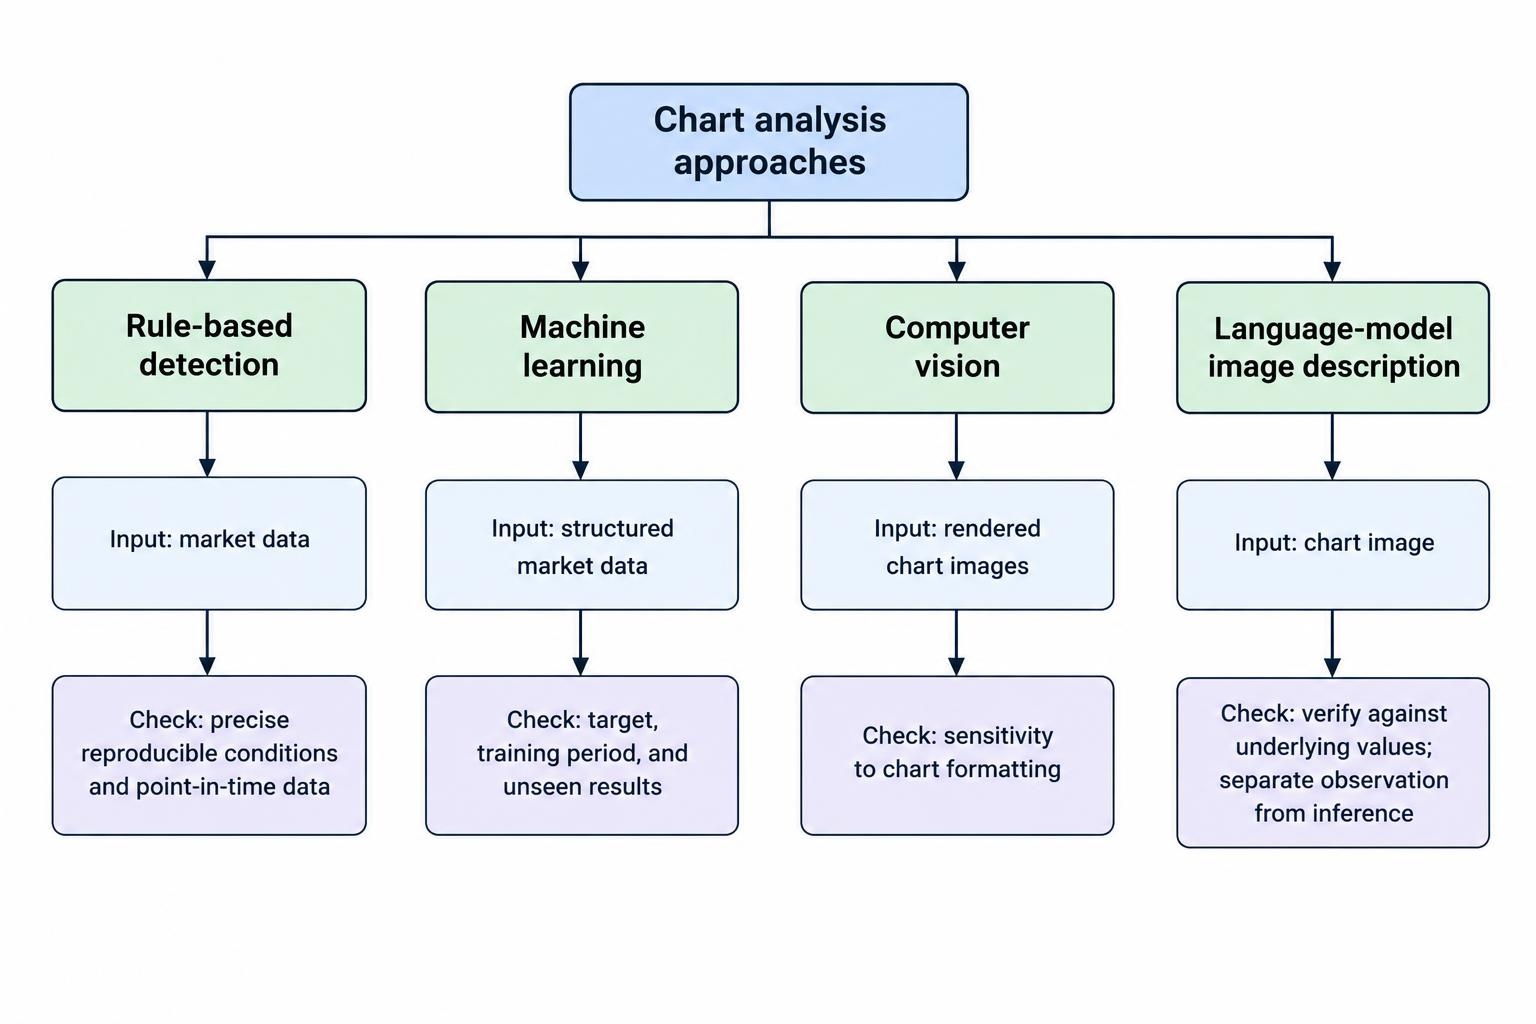
A rule based detector is often the easiest to audit: if a condition says price crossed a moving average, you can inspect the calculation and the timestamps. Machine learning can combine many inputs and learn patterns that are harder to express as a short rule, but its performance depends on the data and evaluation method. Computer vision works from pixels, which may carry visual information but also contain presentation choices such as chart scale, colors, candle width, and indicator overlays.
Language models introduce a further distinction. They can describe what appears in a screenshot, but they may misread axes, dates, candle colors, or small labels. If a model says price broke resistance, verify that statement against the underlying values and the exact candle close. A fluent explanation can still contain a basic visual mistake. For a fuller comparison of the model types behind these systems, read machine learning versus large language models in trading.
Chart images are not the same as market data
A chart image is a rendering of data, not the data itself. The same price series can look quite different when the chart uses a logarithmic scale instead of a linear one, changes its visible date range, or adjusts candle spacing. A screenshot may omit volume, corporate actions, session boundaries, or the instrument’s contract details. If a model analyses only pixels, it can react to layout choices as if they were market features.
Structured data avoids some of those ambiguities. A model can receive open, high, low, close, and volume values with timestamps, along with calculated indicators. That makes inputs easier to inspect and calculations easier to reproduce, though it does not make the model accurate by itself. Data can still be delayed, incomplete, adjusted inconsistently, or mismatched to the traded instrument. The practical question is whether the system’s input reflects what a trader could actually have known at the time.
Image based systems may still be useful when the task depends on visual shape or when a person needs a quick chart summary. But a screenshot should not be treated as a complete record. If a tool makes a claim that affects a decision, check the original time series, confirm the relevant interval, and note whether the chart uses adjusted or unadjusted prices. The choice of model inputs also connects to feature selection for trading models, since adding more indicators does not automatically add useful information.
Pattern names need precise rules
Common chart labels such as “head and shoulders,” “flag,” “double bottom,” and “breakout” can mean different things to different traders. A person may judge a pattern by visual balance or market context; a program needs rules for where the pattern begins and ends, what counts as confirmation, and when it fails. Without those rules, two analysts—or two versions of a model—can label the same chart differently.
Turn a visual idea into observable conditions before testing it. Define the relevant timeframe, the price series, the pattern boundaries, and the event that counts as a signal. For a breakout, for example, specify whether price must trade through a level intraday or close beyond it, how the level is calculated, and whether volume is part of the condition. These choices are not clerical details. They define the strategy being evaluated.
Be wary of a tool that names many patterns without explaining its definitions. A long list of labels can look impressive while leaving the user unable to reproduce or challenge them. Ask whether the software provides marked candles, thresholds, confidence scores, or examples of incorrect classifications. If the answer is only a label and a directional opinion, the output offers little basis for careful review.
Context changes what a pattern means
The same chart shape can appear under very different conditions. A break above a recent range during a sustained trend is not identical to a brief spike during a quiet session, and a reversal pattern after a large move may behave differently from the same shape in a narrow range. Volatility, liquidity, trading hours, news, and the instrument’s broader movement can all affect how a signal should be interpreted. A chart image alone may not show enough of that context.
A useful system should make its context visible rather than hiding it inside a single “buy” or “sell” label. It may report whether volatility is elevated, whether the market has been trending or ranging, and what timeframe its signal uses. Those classifications can still be wrong, but they give the user something concrete to check. See market regime detection for more on separating trends, ranges, and changes in volatility.
Context also prevents a common reading error: treating a pattern as a forecast rather than a condition. A signal can say that a defined event occurred, or that similar past observations had a certain distribution of outcomes. It cannot establish that the next move will follow the most common historical outcome. Even a seemingly strong pattern can fail when conditions change or when a small number of unusual observations dominate the sample.
How to assess an AI chart signal
Start by asking what the signal actually predicts. Does it classify the next candle, estimate the probability of a move over a fixed horizon, identify a pattern, or merely summarize recent price action? These are different tasks and need different tests. “The chart looks bullish” is not a measurable forecast. “The model assigns a probability to a positive return over the next five sessions” is testable, provided the return and probability are defined clearly.
Then inspect the evidence behind the result. Look for the time period used, the markets included, the number of observations, the benchmark, and whether fees and execution assumptions were included. A backtest that selects the best looking chart patterns after testing many variations can overstate performance. The more choices a researcher makes after viewing results, the easier it becomes to find a pattern that fits old data by chance.
Testing should respect time order. A model must not be trained on information from dates that occur after the period used to evaluate its past predictions. The TimeSeriesSplit documentation describes a time ordered approach to splitting data, rather than randomly mixing past and future observations. That method is not a complete trading validation plan, but it illustrates why ordinary shuffled splits can be inappropriate for time series.
Also compare the model with a simple baseline. If an AI system flags a chart, check how often the same rule would have worked without AI, and whether the AI improves on a basic trend or momentum measure after costs. A higher classification accuracy may not translate to better trading results: the size of wins and losses, signal frequency, and costs all matter. Practical testing methods are covered in testing and validating AI trading systems.
Common failure points
False pattern matches. Markets generate a great many shapes, and some will resemble familiar formations by coincidence. A detector can be tuned to find those shapes in historical charts, yet fail to identify useful cases later. Require an explicit definition and test it on data not used to choose the pattern.
Look ahead in the signal. A pattern may seem obvious after several candles have completed. If a backtest assumes entry at the earlier point, when the pattern was not yet confirmed, it gives the system information it did not have. Check exactly when the signal becomes available and use a plausible entry time.
Changing market conditions. A pattern’s observed behavior can shift across assets, periods, and volatility conditions. Results from one instrument or a short historical window may not transfer to another. Review performance across distinct periods and conditions, and set rules for when the model should stop producing signals.
Missing trading costs. A chart signal that triggers frequent entries may look effective before spreads, commissions, slippage, and financing are counted. Real execution may also differ from the assumed price, especially around volatile events or in less liquid markets. Test the strategy with realistic cost assumptions; a perfect entry on every historical signal is a fairy tale, not an execution model.
Confident but unsupported descriptions. A language model may invent a price level, misread a date, or explain a pattern that is not actually present. Ask it to identify the evidence it used, then verify that evidence against the chart or source data. For more on checking errors in AI outputs, see AI hallucinations and source verification.
A practical review workflow
Use AI chart analysis as a screening or documentation aid, with a process that makes each claim checkable. First, define the instrument, interval, and data source. Then record the signal in measurable terms: what condition appeared, when it became visible, and what outcome window matters. If the tool produces a written explanation, separate its direct observations from its interpretation. “The last close exceeded the previous range high” is an observation; “price is likely to keep rising” is a prediction.
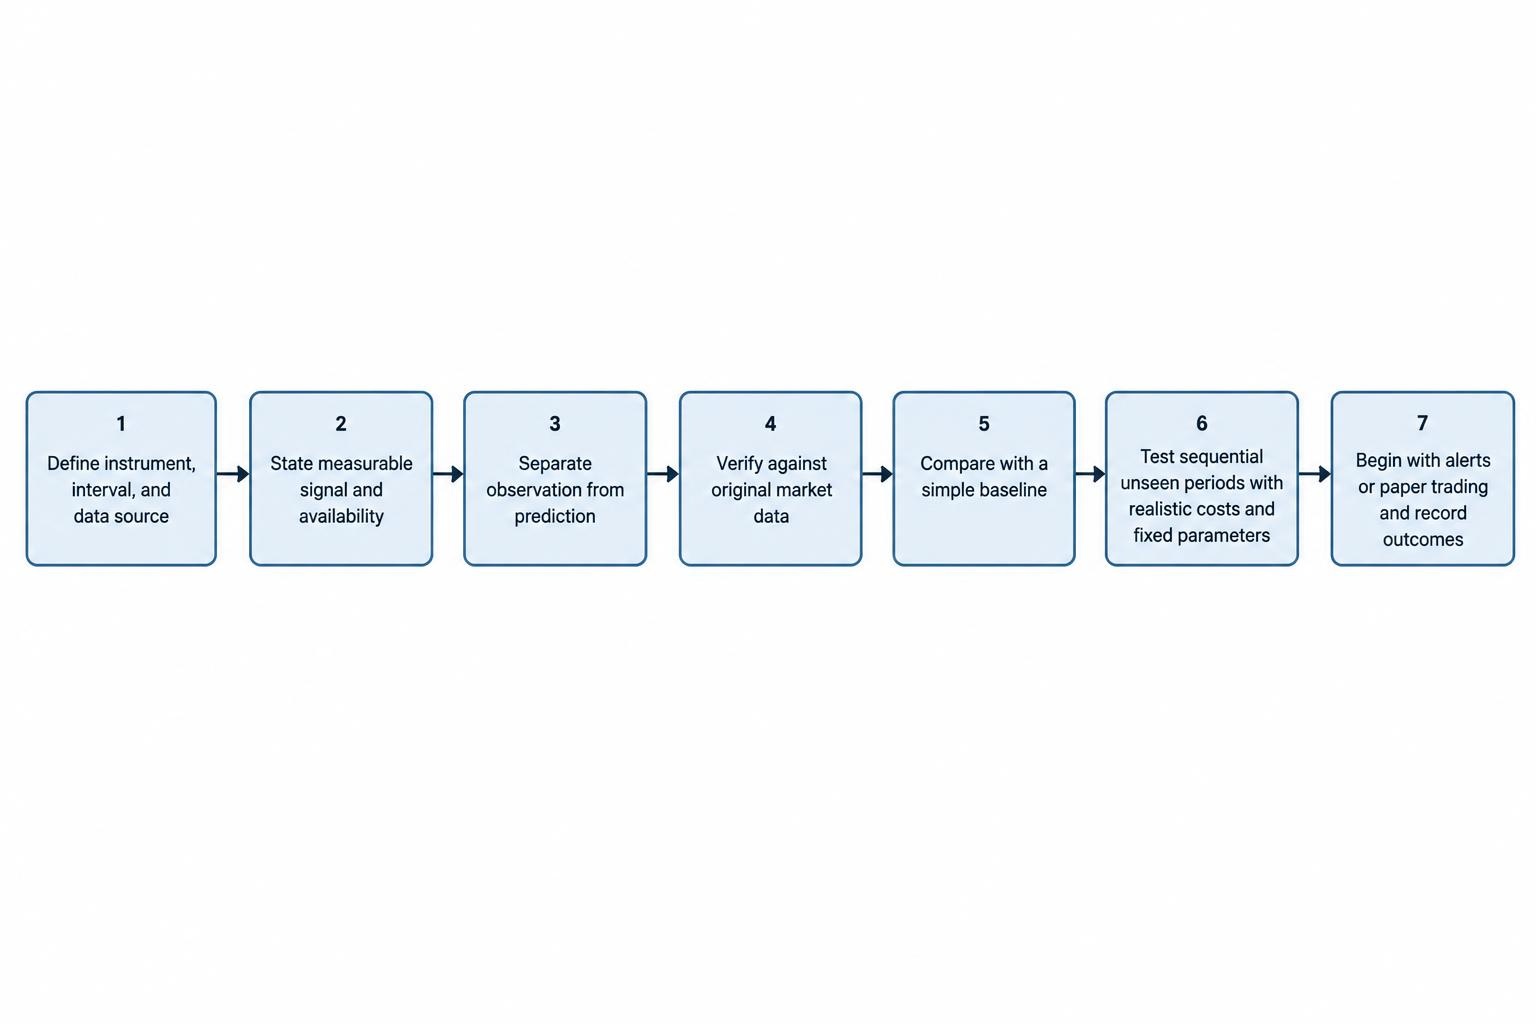
Next, verify the observation against market data and compare it with a baseline. If the signal survives that review, test it on sequential historical periods and account for trading costs. Keep the parameters fixed during each test period; changing thresholds after seeing results turns evaluation into another round of fitting. A separate AI trade filter can be more appropriate than letting a model make every decision, especially when the strategy already has defined entry and risk rules.
For live use, start with alerts or paper trading rather than assuming the historical result will carry over. Record the signal, the chart state, the model version, and the subsequent outcome. Review false positives as carefully as successful examples: those are often where vague definitions or hidden assumptions show up. A trading journal can make that review easier; AI assisted trading journal analysis covers that separate use case.
Questions to ask before relying on a tool
- Does the tool read raw market data, chart images, or both?
- Can it show the exact candles, values, and conditions behind a label?
- Is the output a measured observation, a probability, or a trade recommendation?
- Were the tests conducted on later, unseen data, with costs included?
- Can results be compared with a simple rule or relevant benchmark?
- Does the system state its timeframe and data limitations clearly?
These questions also help separate analytical functions from promotional language. The SEC has brought cases involving investment advisers that made false or misleading claims about their AI use, which is a reminder to check what a product actually does rather than relying on its marketing description. The SEC’s March 2024 enforcement announcement on AI claims describes those cases; it does not certify any particular chart tool or trading method.
Where AI chart analysis fits
AI chart analysis is most useful when it turns a defined observation into a repeatable task: screening charts, measuring a condition, organizing a review, or testing whether a pattern has behaved consistently in historical data. It is less useful when the output is an unexplained label, a confident forecast, or an attractive backtest without enough detail to reproduce it. Human review still matters because the trader must decide whether the data is sound, the signal is relevant, and the risk is acceptable.
Keep the tool’s role narrow. Ask it to identify or measure a condition, verify that result independently, and let a documented strategy determine whether any action follows. An AI can make chart review faster. It cannot remove uncertainty from markets, and a polished chart annotation is not evidence of an edge.